Annotations
Arrow annotations with background
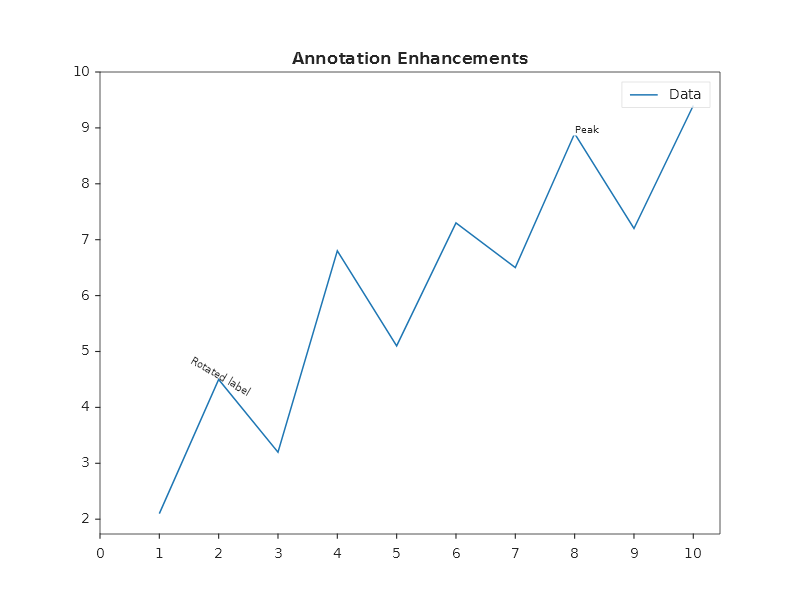
Plt.Create()
    .AddSubPlot(1, 1, 1, ax => ax
        .WithTitle("Annotation Enhancements")
        .Plot(x, y, line => { line.Label = "Data"; })
        .Annotate("Peak", 8, 8.9, ann =>
        {
            ann.ArrowTargetX = 8;
            ann.ArrowTargetY = 8.9;
            ann.ArrowStyle   = ArrowStyle.FancyArrow;
            ann.BackgroundColor = Colors.White;
        })
        .Annotate("Rotated label", 2, 4.5, ann =>
        {
            ann.Rotation  = -30;
            ann.Alignment = TextAlignment.Center;
        }))
    .Save("annotations.svg");
Horizontal reference line
Mark thresholds, targets, or boundaries:
Plt.Create()
    .AddSubPlot(1, 1, 1, ax => ax
        .Plot(x, y, s => s.Label = "Data")
        .AxHLine(5.0, l =>
        {
            l.Color = Colors.Red;
            l.LineStyle = LineStyle.Dashed;
            l.LineWidth = 1.5;
            l.Label = "Threshold";
        })
        .WithLegend())
    .Save("hline.svg");
Vertical reference line
Plt.Create()
    .AddSubPlot(1, 1, 1, ax => ax
        .Plot(x, y)
        .AxVLine(5.0, l =>
        {
            l.Color = Colors.Green;
            l.LineStyle = LineStyle.DashDot;
            l.Label = "Event";
        })
        .WithLegend())
    .Save("vline.svg");
Shaded span regions
Highlight a range on the axis:
Plt.Create()
    .AddSubPlot(1, 1, 1, ax => ax
        .Plot(x, y, s => s.Label = "Signal")
        // Vertical span: highlight an X range
        .AxVSpan(3.0, 6.0, s =>
        {
            s.Color = Colors.Yellow;
            s.Alpha = 0.3;
            s.Label = "Active period";
        })
        // Horizontal span: highlight a Y range
        .AxHSpan(4.0, 7.0, s =>
        {
            s.Color = Colors.LightBlue;
            s.Alpha = 0.2;
            s.Label = "Target range";
        })
        .WithLegend())
    .Save("spans.svg");
Multiple reference lines
Plt.Create()
    .AddSubPlot(1, 1, 1, ax => ax
        .Plot(x, y, s => s.Label = "Price")
        .AxHLine(20, l => { l.Color = Colors.Green; l.LineStyle = LineStyle.Dashed; l.Label = "Support"; })
        .AxHLine(70, l => { l.Color = Colors.Red;   l.LineStyle = LineStyle.Dashed; l.Label = "Resistance"; })
        .AxVLine(5,  l => { l.Color = Colors.Gray;  l.LineStyle = LineStyle.Dotted; l.Label = "Earnings date"; })
        .WithLegend(LegendPosition.UpperLeft))
    .Save("multi_ref.svg");
Threshold convenience
Threshold(...) is a single-call shortcut that composes a dashed reference line
and a shaded breach-zone span in one step. Use it instead of manually calling
AxHLine + AxHSpan when you only care about marking a breach boundary.
double[] x = Enumerable.Range(0, 100).Select(i => (double)i).ToArray();
double[] y = x.Select(v => 50 + 30 * Math.Sin(v * 0.15)).ToArray();

// Shade everything ABOVE 70 (overbought zone)
Plt.Create()
    .AddSubPlot(1, 1, 1, ax => ax
        .Plot(x, y, s => s.Label = "Signal")
        .Threshold(70.0, Orientation.Horizontal, ThresholdBreach.Above,
            color: Colors.Red, label: "Overbought")
        .WithLegend())
    .Save("threshold_above.svg");
Shade the below side for a support floor:
Plt.Create()
    .AddSubPlot(1, 1, 1, ax => ax
        .Plot(x, y, s => s.Label = "Signal")
        .Threshold(30.0, Orientation.Horizontal, ThresholdBreach.Below,
            color: Colors.Tab10Green, label: "Oversold")
        .WithLegend())
    .Save("threshold_below.svg");
Stack both to create a corridor with upper and lower bounds:
Plt.Create()
    .AddSubPlot(1, 1, 1, ax => ax
        .Plot(x, y, s => s.Label = "RSI")
        .Threshold(70.0, Orientation.Horizontal, ThresholdBreach.Above, Colors.Red,   "Overbought")
        .Threshold(30.0, Orientation.Horizontal, ThresholdBreach.Below, Colors.Tab10Green, "Oversold")
        .SetYLabel("RSI")
        .WithLegend())
    .Save("threshold_corridor.svg");
Vertical thresholds work identically — Orientation.Vertical marks a constant X:
// Shade everything to the RIGHT of an event date
DateTime eventDate = new DateTime(2026, 6, 15);

Plt.Create()
    .AddSubPlot(1, 1, 1, ax => ax
        .Plot(dates, prices, s => s.Label = "Price")
        .SetXDateAxis()
        .Threshold(eventDate.ToOADate(), Orientation.Vertical, ThresholdBreach.Above,
            color: Colors.Tab10Orange, label: "Event")
        .WithLegend())
    .Save("threshold_vertical.svg");
Threshold parameters
| Parameter | Type | Default | Description |
|---|---|---|---|
value |
double |
(required) | Threshold position in data coordinates. |
orientation |
Orientation |
(required) | Horizontal = constant Y line; Vertical = constant X line. |
breach |
ThresholdBreach |
(required) | Above shades above/right of the line; Below shades below/left. |
color |
Color? |
null |
Colour for both the dashed line and the span fill. null = renderer cycle colour. |
label |
string? |
null |
Annotation text placed at the threshold value. null = no annotation. |
The dashed line is a ReferenceLine (LineStyle.Dashed, configurable afterwards via
axes.ReferenceLines). The span extends to double.MaxValue (Above) or
double.MinValue (Below) so it always reaches the visible plot boundary.
Combining annotations with math text
Plt.Create()
    .AddSubPlot(1, 1, 1, ax => ax
        .Plot(x, y)
        .Annotate(@"$R^{2} = 0.97$", 3, 7, ann =>
        {
            ann.BackgroundColor = Colors.White;
            ann.FontSize = 14;
        })
        .Annotate(@"$\frac{\partial f}{\partial x} = 0$", 8, 3, ann =>
        {
            ann.ArrowTargetX = 8;
            ann.ArrowTargetY = y[8];
            ann.ArrowStyle = ArrowStyle.FancyArrow;
        }))
    .Save("math_annotations.svg");
Fluent API reference
| Method | Parameters | Description |
|---|---|---|
.Annotate(text, x, y, cfg?) |
text, position | Text annotation at (x, y) |
.Annotate(text, x, y, arrowX, arrowY, cfg?) |
+ arrow target | Text with arrow pointing to target |
.AxHLine(y, cfg?) |
y position | Horizontal reference line |
.AxVLine(x, cfg?) |
x position | Vertical reference line |
.AxHSpan(yMin, yMax, cfg?) |
y range | Horizontal shaded band |
.AxVSpan(xMin, xMax, cfg?) |
x range | Vertical shaded band |
.Threshold(value, orientation, breach, color?, label?) |
value, orientation, breach | Dashed reference line + shaded breach span |
Annotation properties
| Property | Type | Description |
|---|---|---|
ArrowTargetX/Y |
double |
Arrow endpoint |
ArrowStyle |
ArrowStyle |
FancyArrow, Simple, ... |
BackgroundColor |
Color |
Text background |
FontSize |
double |
Font size |
Rotation |
double |
Text rotation in degrees |
Alignment |
TextAlignment |
Left, Center, Right |
ReferenceLine properties
| Property | Type | Description |
|---|---|---|
Color |
Color |
Line color |
LineStyle |
LineStyle |
Solid, Dashed, Dotted, DashDot |
LineWidth |
double |
Line width |
Label |
string |
Legend label |
SpanRegion properties
| Property | Type | Description |
|---|---|---|
Color |
Color |
Fill color |
Alpha |
double |
Transparency (0–1) |
Label |
string |
Legend label |