Bar Charts
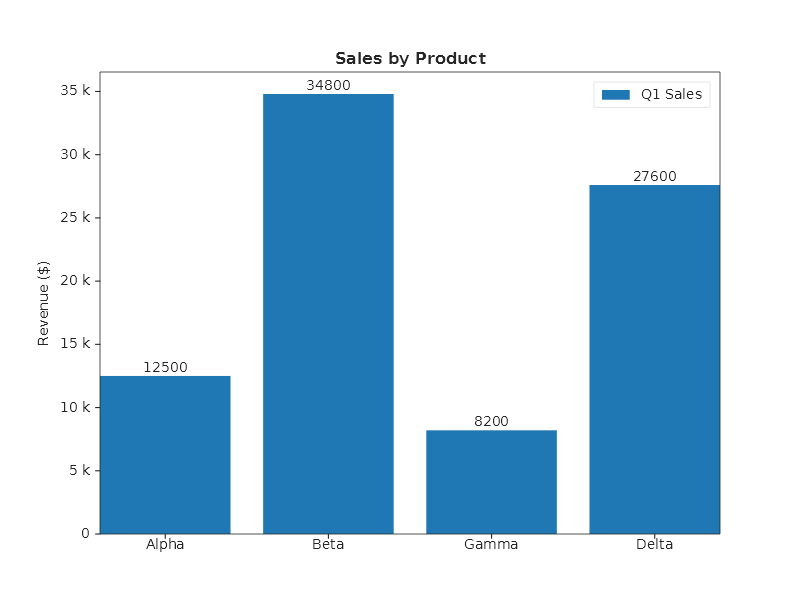
Bar chart with labels
string[] products = ["Alpha", "Beta", "Gamma", "Delta"];
double[] sales    = [12_500, 34_800, 8_200, 27_600];

Plt.Create()
    .AddSubPlot(1, 1, 1, ax => ax
        .WithTitle("Sales by Product")
        .SetYLabel("Revenue ($)")
        .Bar(products, sales, bar => { bar.Color = Colors.Tab10Blue; bar.Label = "Q1 Sales"; })
        .WithBarLabels("F0")
        .SetYTickFormatter(new EngFormatter()))
    .Save("bar_labels.svg");
Horizontal bars
Plt.Create()
    .AddSubPlot(1, 1, 1, ax => ax
        .Bar(products, sales, s =>
        {
            s.Orientation = BarOrientation.Horizontal;
            s.Color = Colors.Teal;
        })
        .WithBarLabels())
    .Save("bar_horizontal.svg");
Stacked bars
Plt.Create()
    .AddSubPlot(1, 1, 1, ax => ax
        .SetBarMode(BarMode.Stacked)
        .Bar(products, q1, s => { s.Color = Colors.Tab10Blue; s.Label = "Q1"; })
        .Bar(products, q2, s => { s.Color = Colors.Orange;    s.Label = "Q2"; })
        .Bar(products, q3, s => { s.Color = Colors.Green;     s.Label = "Q3"; })
        .WithLegend()
        .WithBarLabels())
    .Save("bar_stacked.svg");
Grouped bars
Plt.Create()
    .AddSubPlot(1, 1, 1, ax => ax
        .SetBarMode(BarMode.Grouped)
        .Bar(products, q1, s => { s.Color = Colors.CornflowerBlue; s.Label = "Q1"; })
        .Bar(products, q2, s => { s.Color = Colors.Salmon;         s.Label = "Q2"; })
        .WithLegend(LegendPosition.UpperLeft))
    .Save("bar_grouped.svg");
Bar width, edge color, and alpha
Plt.Create()
    .AddSubPlot(1, 1, 1, ax => ax
        .Bar(products, sales, s =>
        {
            s.Color = Colors.CornflowerBlue;
            s.EdgeColor = Colors.Navy;
            s.LineWidth = 1.5;
            s.BarWidth = 0.5;   // narrower bars (default 0.8)
            s.Alpha = 0.7;
            s.Align = BarAlignment.Center;
        }))
    .Save("bar_styled.svg");
Hatching patterns
Add texture to bars for print-friendly charts:
Plt.Create()
    .AddSubPlot(1, 1, 1, ax => ax
        .Bar(products, q1, s =>
        {
            s.Color = Colors.LightBlue;
            s.Hatch = HatchPattern.Slash;
            s.HatchColor = Colors.DarkBlue;
            s.Label = "Q1";
        })
        .Bar(products, q2, s =>
        {
            s.Color = Colors.LightCoral;
            s.Hatch = HatchPattern.BackslashDouble;
            s.HatchColor = Colors.DarkRed;
            s.Label = "Q2";
        })
        .WithLegend())
    .Save("bar_hatched.svg");
Bar labels with custom format
Plt.Create()
    .AddSubPlot(1, 1, 1, ax => ax
        .Bar(products, sales, s =>
        {
            s.ShowLabels = true;
            s.LabelFormat = "C0";  // currency format
        }))
    .Save("bar_custom_labels.svg");
Fluent API reference — BarSeries
| Property | Type | Default | Description |
|---|---|---|---|
Color |
Color |
auto | Bar fill color |
EdgeColor |
Color |
auto | Bar outline color |
LineWidth |
double |
0.5 |
Outline width |
BarWidth |
double |
0.8 |
Width as fraction |
Orientation |
BarOrientation |
Vertical |
Vertical or Horizontal |
Align |
BarAlignment |
Center |
Center or Edge |
Alpha |
double |
1.0 |
Transparency (0–1) |
Hatch |
HatchPattern |
None |
Slash, Backslash, Dash, Pipe, CrossHash, ... |
HatchColor |
Color |
auto | Hatch pattern color |
ShowLabels |
bool |
false |
Display value labels |
LabelFormat |
string |
"G4" |
.NET format string for labels |
Label |
string |
none | Legend label |
| Axes method | Description |
|---|---|
.SetBarMode(BarMode.Stacked) |
Stack multiple bar series |
.SetBarMode(BarMode.Grouped) |
Side-by-side grouped bars |
.WithBarLabels(format?) |
Show value labels on last bar |
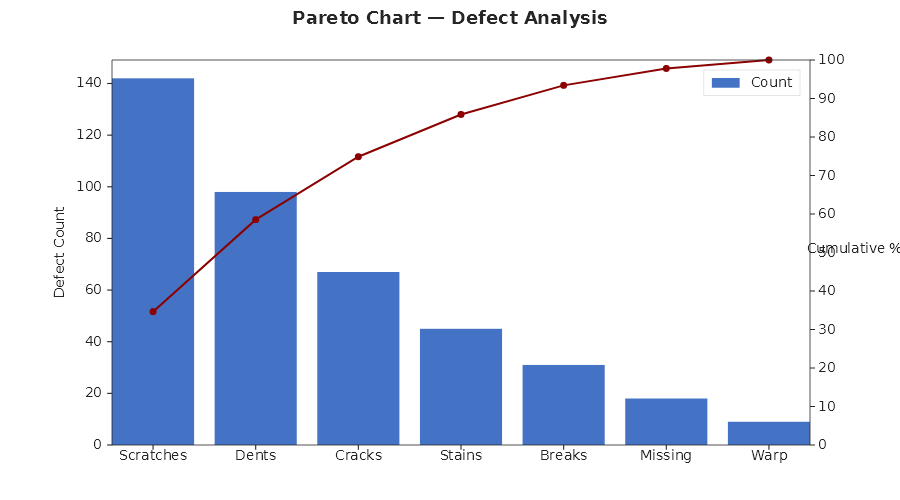
Pareto chart
string[] defects = ["Scratches", "Dents", "Cracks", "Stains", "Breaks", "Missing", "Warp"];
double[] counts = [142, 98, 67, 45, 31, 18, 9];
double total = counts.Sum();
double running = 0;
double[] cumPct = counts.Select(c => { running += c; return running / total * 100; }).ToArray();
double[] barCenters = Enumerable.Range(0, defects.Length).Select(i => i + 0.5).ToArray();

Plt.Create()
    .WithTitle("Pareto Chart — Defect Analysis")
    .WithSize(900, 500)
    .AddSubPlot(1, 1, 1, ax => ax
        .Bar(defects, counts, s => { s.Color = Color.FromHex("#4472C4"); s.Label = "Count"; })
        .WithSecondaryYAxis(y2 => y2
            .Plot(barCenters, cumPct, s => { s.Color = Color.FromHex("#8B0000"); s.LineWidth = 2; s.Marker = MarkerStyle.Circle; s.Label = "Cumulative %"; })
            .SetYLim(0, 100)
            .SetYLabel("Cumulative %"))
        .SetYLabel("Defect Count")
        .WithLegend())
    .Save("pareto_chart.svg");
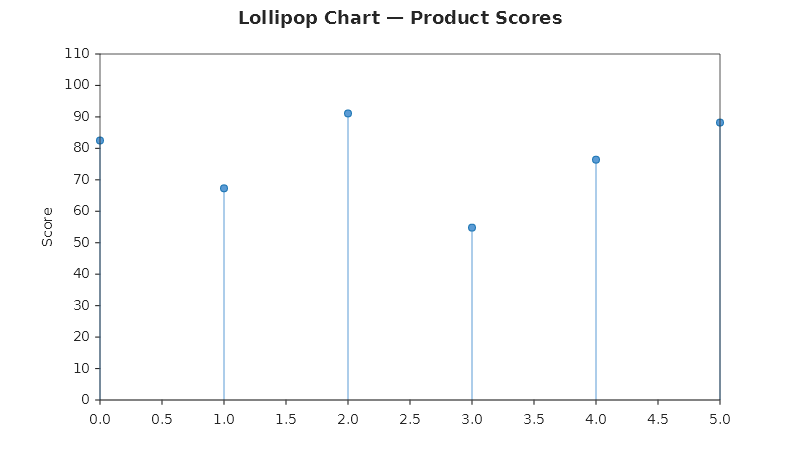
Lollipop chart
// Products at indices 0-5
double[] scores = [82.5, 67.3, 91.1, 54.8, 76.4, 88.2];
double[] xIdx = Enumerable.Range(0, scores.Length).Select(i => (double)i).ToArray();

Plt.Create()
    .WithTitle("Lollipop Chart — Product Scores")
    .WithSize(800, 450)
    .AddSubPlot(1, 1, 1, ax => ax
        .Stem(xIdx, scores, s => { s.StemColor = Color.FromHex("#5B9BD5"); })
        .Scatter(xIdx, scores, s => { s.Color = Color.FromHex("#5B9BD5"); s.MarkerSize = 14; s.Marker = MarkerStyle.Circle; })
        .SetYLim(0, 110)
        .SetYLabel("Score"))
    .Save("lollipop_chart.svg");
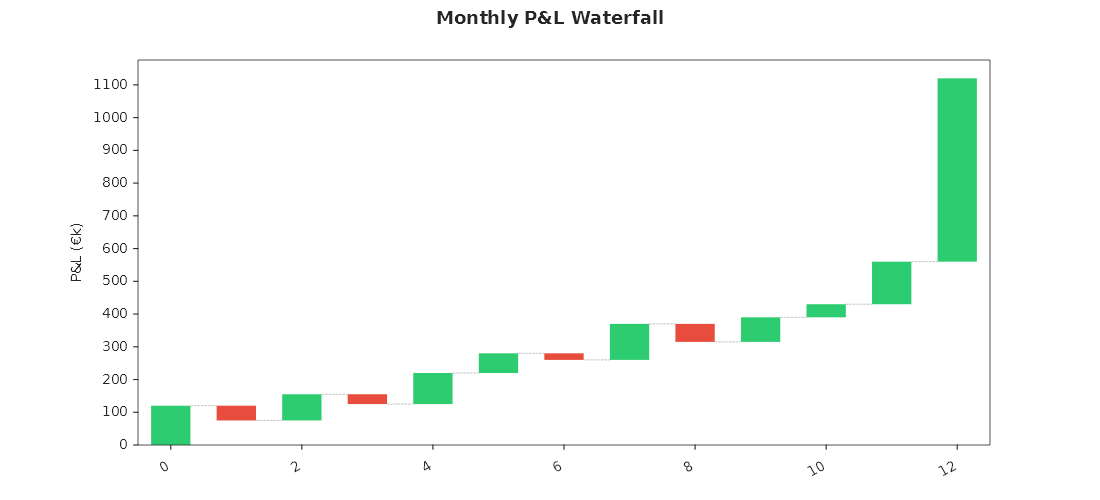
Monthly P&L waterfall
string[] months = ["Jan", "Feb", "Mar", "Apr", "May", "Jun", "Jul", "Aug", "Sep", "Oct", "Nov", "Dec", "Total"];
double[] pnl = [120, -45, 80, -30, 95, 60, -20, 110, -55, 75, 40, 130, 0];
pnl[12] = pnl[..12].Sum();

Plt.Create()
    .WithTitle("Monthly P&L Waterfall")
    .WithSize(1100, 500)
    .AddSubPlot(1, 1, 1, ax => ax
        .Waterfall(months, pnl, s =>
        {
            s.IncreaseColor = Color.FromHex("#2ECC71");
            s.DecreaseColor = Color.FromHex("#E74C3C");
            s.TotalColor = Color.FromHex("#3498DB");
            s.BarWidth = 0.6;
        })
        .SetYLabel("P&L (€k)")
        .WithXTickLabelRotation(30))
    .Save("waterfall_pnl.svg");