Broken / Discontinuous Axes
Remove a range from the axis to show widely separated data without wasting space.
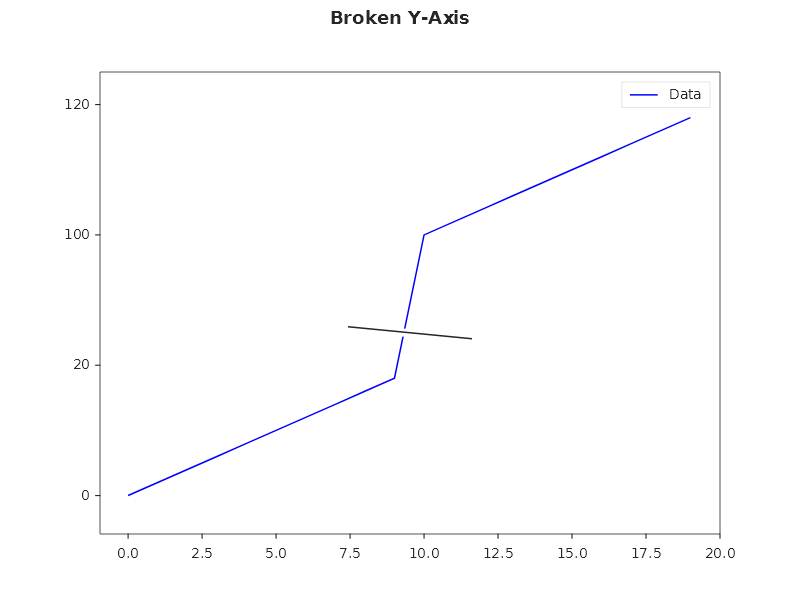
Y-axis break
double[] x = Enumerable.Range(0, 20).Select(i => (double)i).ToArray();
double[] y = x.Select(v => v < 10 ? v * 2 : v * 2 + 80).ToArray();

Plt.Create()
    .AddSubPlot(1, 1, 1, ax => ax
        .Plot(x, y, s => s.Label = "Data")
        .WithYBreak(25, 85)  // remove the gap between 25 and 85
        .WithLegend())
    .Save("broken_y.svg");
X-axis break
Plt.Create()
    .AddSubPlot(1, 1, 1, ax => ax
        .Plot(x, y)
        .WithXBreak(5, 15))  // skip the middle
    .Save("broken_x.svg");
Break styles
Three visual styles for the break marker:
var builder = Plt.Create()
    .WithSize(1200, 400)
    .WithTitle("Break Styles");

builder.AddSubPlot(1, 3, 1, ax => ax
    .Plot(x, y).WithYBreak(25, 85, BreakStyle.Zigzag).WithTitle("Zigzag (default)"));

builder.AddSubPlot(1, 3, 2, ax => ax
    .Plot(x, y).WithYBreak(25, 85, BreakStyle.Diagonal).WithTitle("Diagonal"));

builder.AddSubPlot(1, 3, 3, ax => ax
    .Plot(x, y).WithYBreak(25, 85, BreakStyle.None).WithTitle("None (invisible)"));

builder.TightLayout().Save("break_styles.svg");
Combined X + Y break
Plt.Create()
    .AddSubPlot(1, 1, 1, ax => ax
        .Scatter(x, y, s => { s.Color = Colors.Red; s.MarkerSize = 8; })
        .WithXBreak(5, 15, BreakStyle.Zigzag)
        .WithYBreak(25, 85, BreakStyle.Diagonal)
        .WithTitle("Both axes broken"))
    .Save("broken_both.svg");
Practical example: outlier handling
// Sales data with one extreme outlier
string[] months = ["Jan", "Feb", "Mar", "Apr", "May", "Jun"];
double[] sales = [120, 135, 8500, 142, 128, 155]; // March is a one-off bulk order

Plt.Create()
    .AddSubPlot(1, 1, 1, ax => ax
        .Bar(months, sales, s => { s.Color = Colors.Teal; s.Label = "Sales ($K)"; })
        .WithYBreak(200, 8000)  // compress the gap
        .WithBarLabels("F0")
        .WithLegend())
    .Save("broken_outlier.svg");
Fluent API reference
| Method | Parameters | Description |
|---|---|---|
.WithXBreak(from, to) |
double, double |
Remove X range |
.WithXBreak(from, to, style) |
+ BreakStyle |
With visual style |
.WithYBreak(from, to) |
double, double |
Remove Y range |
.WithYBreak(from, to, style) |
+ BreakStyle |
With visual style |
| BreakStyle | Description |
|---|---|
Zigzag |
Zigzag lines at break (default) |
Diagonal |
Straight diagonal lines |
None |
No visual marker |