Contour Plots
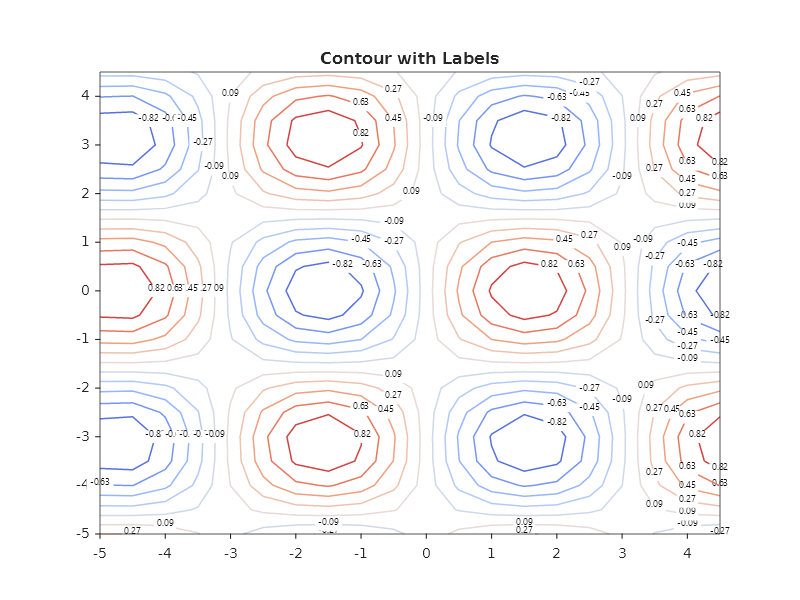
Contour lines with labels
double[] x = Enumerable.Range(0, 20).Select(i => i * 0.5 - 5.0).ToArray();
double[] y = Enumerable.Range(0, 20).Select(i => i * 0.5 - 5.0).ToArray();
var z = new double[20, 20];
for (int r = 0; r < 20; r++)
    for (int c = 0; c < 20; c++)
        z[r, c] = Math.Sin(x[c]) * Math.Cos(y[r]);

Plt.Create()
    .AddSubPlot(1, 1, 1, ax => ax
        .WithTitle("Contour with Labels")
        .Contour(x, y, z, s =>
        {
            s.ShowLabels = true;
            s.LabelFormat = "F2";
            s.LabelFontSize = 9;
        })
        .WithColorMap("coolwarm"))
    .Save("contour_labels.svg");
v1.7.2 Phase L.9 — strict colormap lookup.
AxesBuilder.WithColorMap(string)throwsArgumentExceptionwith a list of registered names if the name is unknown (e.g. a typo like"virdis"). Pre-fix the call silently no-op'd and the renderer fell back to Viridis, masking the bug. For defensive lookup that doesn't throw, fetch the instance yourself viaColorMapRegistry.Get(name)and use theWithColorMap(IColorMap)overload only when non-null.
Filled contour (contourf)
Plt.Create()
    .AddSubPlot(1, 1, 1, ax => ax
        .WithTitle("Filled Contour")
        .Contourf(x, y, z, s =>
        {
            s.Levels = 15;
            s.ColorMap = ColorMaps.Viridis;
        })
        .WithColorBar(cb => cb with { Label = "Amplitude" }))
    .Save("contourf.svg");
Custom contour levels
Plt.Create()
    .AddSubPlot(1, 1, 1, ax => ax
        .Contour(x, y, z, s =>
        {
            // Explicit level values instead of auto count
            s.LevelValues = [-0.8, -0.4, 0, 0.4, 0.8];
            s.ShowLabels = true;
            s.LabelFormat = "F1";
            s.LineWidth = 1.5;
        })
        .WithColorMap("RdBu"))
    .Save("contour_custom_levels.svg");
Contour with level count
Plt.Create()
    .AddSubPlot(1, 1, 1, ax => ax
        .Contour(x, y, z, s =>
        {
            s.Levels = 20;           // 20 contour lines
            s.ShowLabels = false;    // no inline labels
        })
        .WithColorMap("plasma")
        .WithColorBar())
    .Save("contour_dense.svg");
Contour + filled contour overlay
Plt.Create()
    .AddSubPlot(1, 1, 1, ax => ax
        .WithTitle("Filled + Line Contour")
        .Contourf(x, y, z, s => { s.Levels = 12; s.ColorMap = ColorMaps.Coolwarm; })
        .Contour(x, y, z, s =>
        {
            s.Levels = 12;
            s.ShowLabels = true;
            s.LabelFormat = "F2";
            s.LineWidth = 0.8;
        })
        .WithColorBar())
    .Save("contour_overlay.svg");
Triangulated contour
For irregularly spaced data (Delaunay triangulation):
Plt.Create()
    .AddSubPlot(1, 1, 1, ax => ax
        .Tricontour(xIrregular, yIrregular, zIrregular)
        .WithColorMap("viridis")
        .WithColorBar())
    .Save("tricontour.svg");
Fluent API reference — ContourSeries
| Property | Type | Default | Description |
|---|---|---|---|
Levels |
int |
10 |
Number of contour levels |
LevelValues |
double[] |
auto | Explicit contour level values |
Filled |
bool |
false |
Filled (contourf) vs lines only |
ShowLabels |
bool |
false |
Show level values on contour lines |
LabelFormat |
string |
"G" |
.NET format string for labels |
LabelFontSize |
double |
8 |
Label font size |
ColorMap |
IColorMap |
auto | Colormap for level colors |
LineWidth |
double |
1.0 |
Contour line width |