Distribution Charts
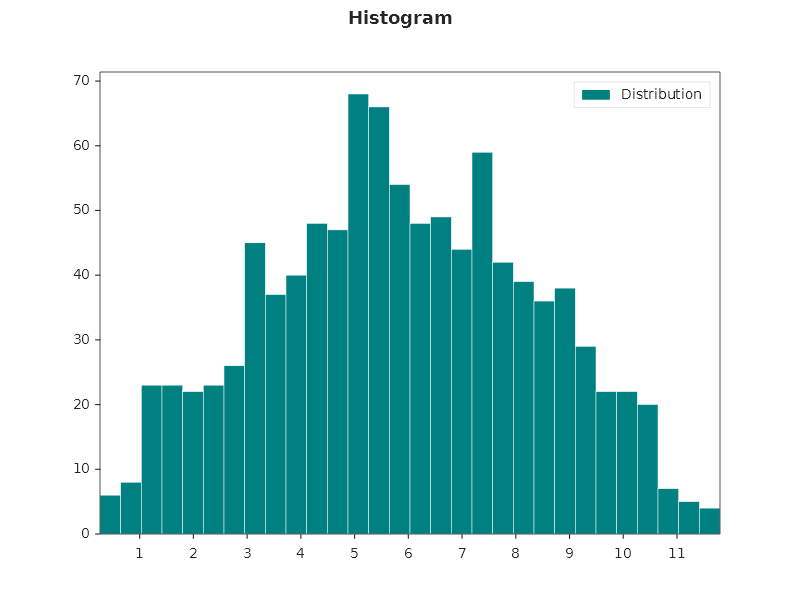
Histogram
var rng = new Random(42);
double[] data = Enumerable.Range(0, 1000)
    .Select(_ => rng.NextDouble() * 6 + rng.NextDouble() * 6)
    .ToArray();

Plt.Create()
    .AddSubPlot(1, 1, 1, ax => ax
        .Hist(data, 30, s => { s.Color = Colors.Teal; s.Label = "Distribution"; })
        .WithLegend())
    .Save("histogram.svg");
Histogram with density normalization
Plt.Create()
    .AddSubPlot(1, 1, 1, ax => ax
        .Hist(data, 30, s =>
        {
            s.Color = Colors.CornflowerBlue;
            s.Density = true;        // normalize to probability density
            s.EdgeColor = Colors.White;
            s.Alpha = 0.7;
            s.Label = "Density";
        })
        .SetYLabel("Probability density")
        .WithLegend())
    .Save("hist_density.svg");
Cumulative histogram
Plt.Create()
    .AddSubPlot(1, 1, 1, ax => ax
        .Hist(data, 50, s =>
        {
            s.Cumulative = true;
            s.Color = Colors.Salmon;
            s.HistType = HistType.Step;   // step outline (no fill)
            s.LineWidth = 2.0;
            s.Label = "Cumulative";
        })
        .WithLegend())
    .Save("hist_cumulative.svg");
Histogram with hatching
Print-friendly with Hatch and HatchColor:
Plt.Create()
    .AddSubPlot(1, 1, 1, ax => ax
        .Hist(data, 20, s =>
        {
            s.Color = Colors.LightBlue;
            s.Hatch = HatchPattern.Slash;
            s.HatchColor = Colors.DarkBlue;
            s.EdgeColor = Colors.DarkBlue;
            s.RWidth = 0.9;   // bar width as fraction of bin width
        }))
    .Save("hist_hatched.svg");
Overlapping histograms
var rng = new Random(42);
double[] group1 = Enumerable.Range(0, 500).Select(_ => rng.NextGaussian(5, 1.5)).ToArray();
double[] group2 = Enumerable.Range(0, 500).Select(_ => rng.NextGaussian(7, 2.0)).ToArray();

Plt.Create()
    .AddSubPlot(1, 1, 1, ax => ax
        .Hist(group1, 30, s => { s.Color = Colors.Blue; s.Alpha = 0.5; s.Label = "Group A"; })
        .Hist(group2, 30, s => { s.Color = Colors.Red;  s.Alpha = 0.5; s.Label = "Group B"; })
        .WithLegend())
    .Save("hist_overlap.svg");
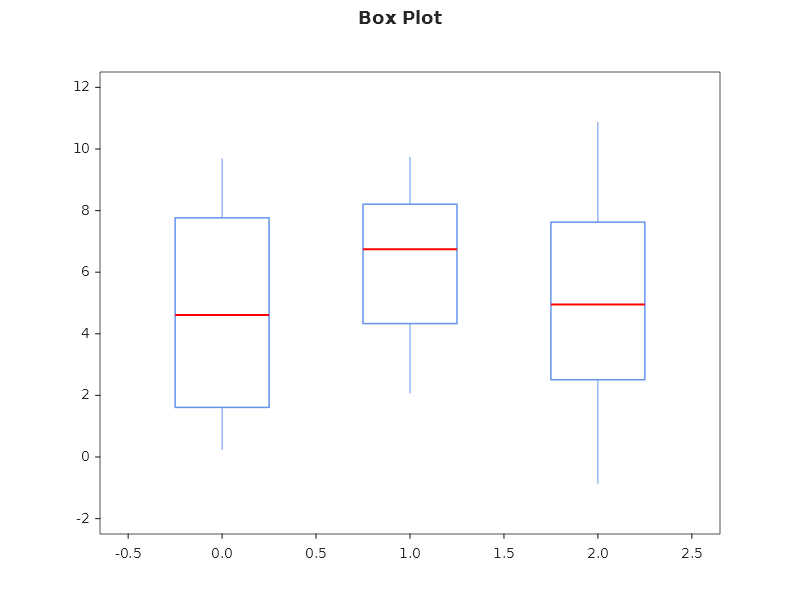
Box plot
double[][] groups = [
    Enumerable.Range(0, 50).Select(_ => rng.NextDouble() * 10).ToArray(),
    Enumerable.Range(0, 50).Select(_ => rng.NextDouble() * 8 + 2).ToArray(),
    Enumerable.Range(0, 50).Select(_ => rng.NextDouble() * 12 - 1).ToArray(),
];

Plt.Create()
    .AddSubPlot(1, 1, 1, ax => ax
        .Box(groups, ["Group A", "Group B", "Group C"], s =>
        {
            s.Color = Colors.CornflowerBlue;
            s.Alpha = 0.8;
            s.EdgeColor = Colors.Navy;
        }))
    .Save("boxplot.svg");
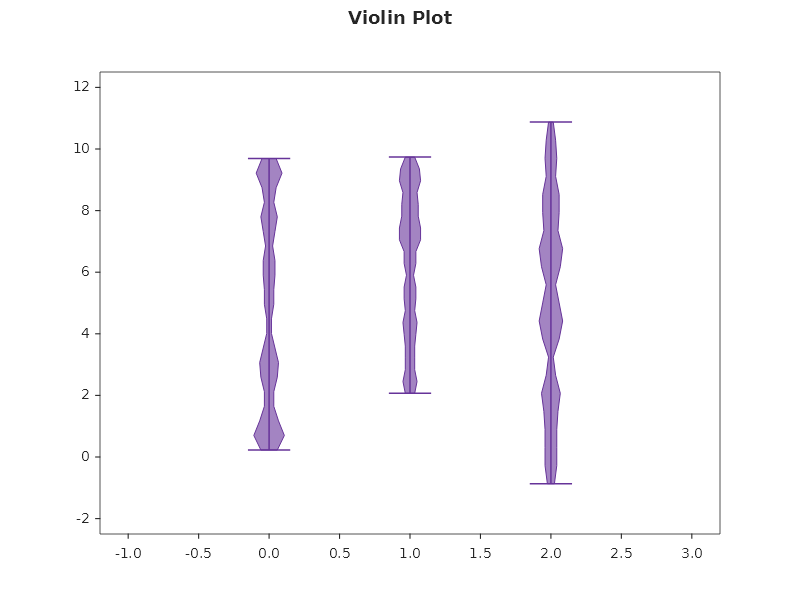
Violin plot
Plt.Create()
    .AddSubPlot(1, 1, 1, ax => ax
        .Violin(groups, ["A", "B", "C"], s =>
        {
            s.Color = Colors.MediumPurple;
            s.Alpha = 0.6;
            s.EdgeColor = Colors.DarkViolet;
        }))
    .Save("violin.svg");
KDE (Kernel Density Estimation)
Plt.Create()
    .AddSubPlot(1, 1, 1, ax => ax
        .Kde(data, s => { s.Label = "Density"; s.Color = Colors.Purple; s.LineWidth = 2.0; })
        .WithLegend())
    .Save("kde.svg");
Combined: Histogram + KDE + Rug
Plt.Create()
    .AddSubPlot(1, 1, 1, ax => ax
        .Hist(data, 30, s => { s.Color = Colors.LightBlue; s.Alpha = 0.5; s.Density = true; })
        .Kde(data, s => { s.Color = Colors.DarkBlue; s.LineWidth = 2; s.Label = "KDE"; })
        .Rugplot(data, s => { s.Color = Colors.DarkBlue; s.Alpha = 0.3; })
        .SetYLabel("Density")
        .WithLegend())
    .Save("hist_kde_rug.svg");
Fluent API reference — HistogramSeries
| Property | Type | Default | Description |
|---|---|---|---|
Color |
Color |
auto | Bar color |
EdgeColor |
Color |
auto | Bar edge color |
Bins |
int |
10 |
Number of bins |
Density |
bool |
false |
Normalize to probability density |
Cumulative |
bool |
false |
Cumulative histogram |
HistType |
HistType |
Bar |
Bar, Step, StepFilled |
Weights |
double[] |
none | Per-value weights |
RWidth |
double |
1.0 |
Bar width as fraction of bin width |
Alpha |
double |
1.0 |
Transparency (0–1) |
Hatch |
HatchPattern |
None |
Texture pattern |
HatchColor |
Color |
auto | Hatch pattern color |
LineWidth |
double |
0.5 |
Edge/step line width |
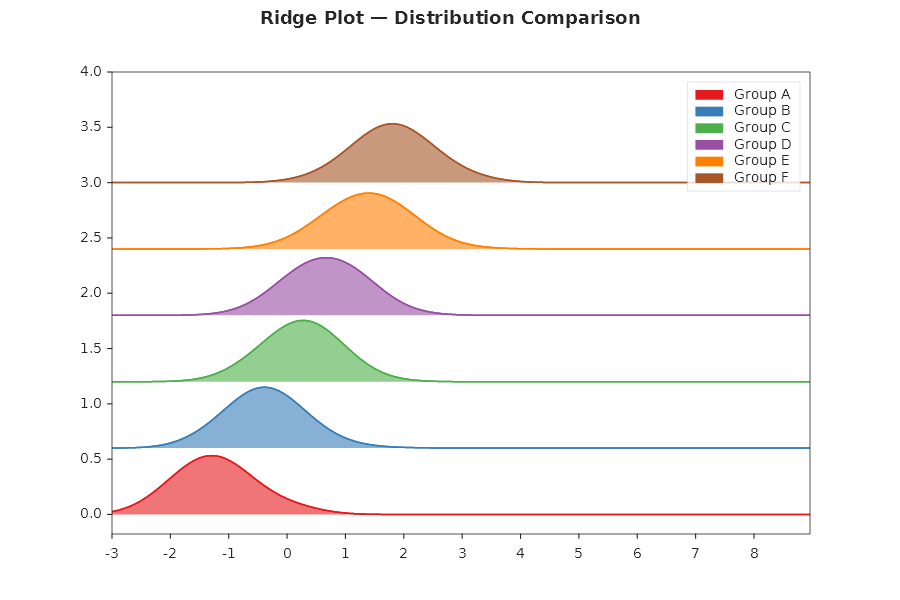
Ridge plot
Show the distribution of multiple groups offset vertically using manual KDE + FillBetween.
var rng = new Random(42);
double BM(Random r) { double u1 = 1 - r.NextDouble(), u2 = 1 - r.NextDouble(); return Math.Sqrt(-2 * Math.Log(u1)) * Math.Sin(2 * Math.PI * u2); }
double[] xGrid = Enumerable.Range(0, 300).Select(i => i * 0.04 - 3.0).ToArray();

double[] GaussKde(double[] data, double bw = 0.5) =>
    xGrid.Select(xi => data.Sum(d => { double z = (xi - d) / bw; return Math.Exp(-0.5 * z * z) / (bw * Math.Sqrt(2 * Math.PI)); }) / data.Length).ToArray();

string[] groups = ["Group A", "Group B", "Group C", "Group D", "Group E", "Group F"];
double[] means = [-1.2, -0.4, 0.2, 0.7, 1.3, 1.9];
var palette = new[] { "#E41A1C", "#377EB8", "#4DAF4A", "#984EA3", "#FF7F00", "#A65628" };

Plt.Create()
    .WithTitle("Ridge Plot")
    .WithSize(900, 600)
    .AddSubPlot(1, 1, 1, ax =>
    {
        for (int g = 0; g < groups.Length; g++)
        {
            double offset = g * 0.6;
            double[] data = Enumerable.Range(0, 200).Select(_ => means[g] + BM(rng) * 0.6).ToArray();
            double[] kde = GaussKde(data);
            double[] kdeShifted = kde.Select(v => v + offset).ToArray();
            double[] baseline = Enumerable.Repeat(offset, xGrid.Length).ToArray();
            var col = Color.FromHex(palette[g]);
            ax.FillBetween(xGrid, kdeShifted, baseline, s => { s.Color = col; s.Alpha = 0.6; s.Label = groups[g]; });
            ax.Plot(xGrid, kdeShifted, s => { s.Color = col; s.LineWidth = 1.5; });
        }
        ax.WithLegend();
    })
    .Save("ridge_plot.svg");