Error Bars
Symmetric error bars
double[] x = [1, 2, 3, 4, 5];
double[] y = [2.1, 4.5, 3.2, 6.8, 5.1];
double[] yerr = [0.5, 0.3, 0.8, 0.4, 0.6];

Plt.Create()
    .AddSubPlot(1, 1, 1, ax => ax
        .ErrorBar(x, y, yerr, s =>
        {
            s.Color = Colors.Blue;
            s.Label = "Measurement";
        })
        .WithLegend())
    .Save("error_bars.svg");
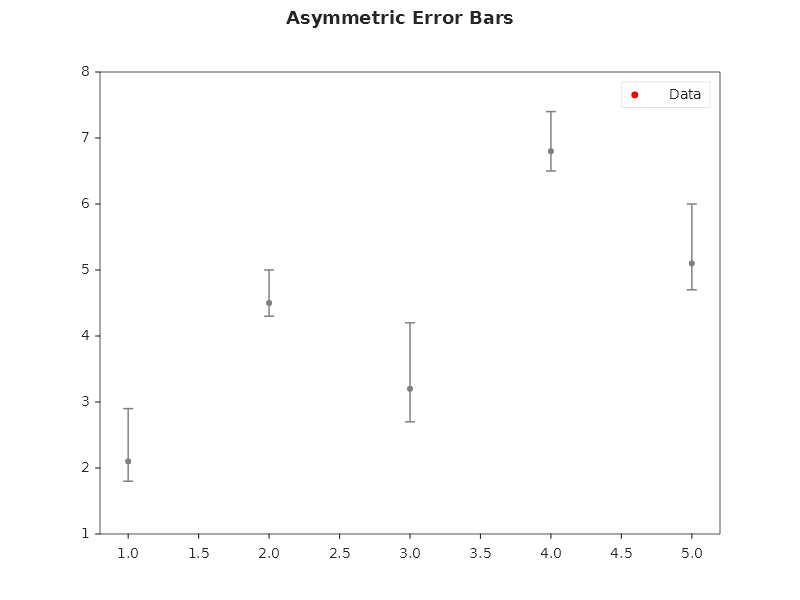
Asymmetric error bars
double[] yerrLow = [0.3, 0.2, 0.5, 0.3, 0.4];
double[] yerrHigh = [0.8, 0.5, 1.0, 0.6, 0.9];

Plt.Create()
    .AddSubPlot(1, 1, 1, ax => ax
        .ErrorBar(x, y, yerrLow, yerrHigh, s =>
        {
            s.Color = Colors.DarkRed;
            s.CapSize = 6;        // width of the error bar caps
            s.LineWidth = 1.5;
        }))
    .Save("asymmetric_errors.svg");
Error bars with styling
Plt.Create()
    .AddSubPlot(1, 1, 1, ax => ax
        .ErrorBar(x, y, yerr, s =>
        {
            s.Color = Colors.Navy;
            s.CapSize = 8;
            s.LineWidth = 2.0;
            s.Alpha = 0.8;
            s.Label = "Experiment A";
        })
        .WithLegend())
    .Save("error_styled.svg");
Combined: scatter + error bars
Plt.Create()
    .AddSubPlot(1, 1, 1, ax => ax
        .Scatter(x, y, s =>
        {
            s.Color = Colors.Red;
            s.MarkerSize = 10;
            s.Marker = MarkerStyle.Diamond;
            s.Label = "Data";
        })
        .ErrorBar(x, y, yerrLow, yerrHigh, s =>
        {
            s.Color = Colors.Gray;
            s.CapSize = 5;
            s.LineWidth = 1.0;
        })
        .WithLegend())
    .Save("scatter_errors.svg");
Error bars with fill-between confidence band
double[] yUpper = y.Zip(yerrHigh, (v, e) => v + e).ToArray();
double[] yLower = y.Zip(yerrLow, (v, e) => v - e).ToArray();

Plt.Create()
    .AddSubPlot(1, 1, 1, ax => ax
        .Plot(x, y, s => { s.Color = Colors.Blue; s.Label = "Mean"; })
        .FillBetween(x, yLower, yUpper, s =>
        {
            s.Color = Colors.Blue;
            s.Alpha = 0.2;
            s.Label = "95% CI";
        })
        .WithLegend())
    .Save("error_confidence.svg");
Fluent API reference — ErrorBarSeries
| Property |
Type |
Default |
Description |
Color |
Color |
auto |
Line and cap color |
CapSize |
double |
3 |
Width of error bar caps in pixels |
LineWidth |
double |
1.0 |
Error bar line width |
Alpha |
double |
1.0 |
Transparency (0–1) |
Label |
string |
none |
Legend label |
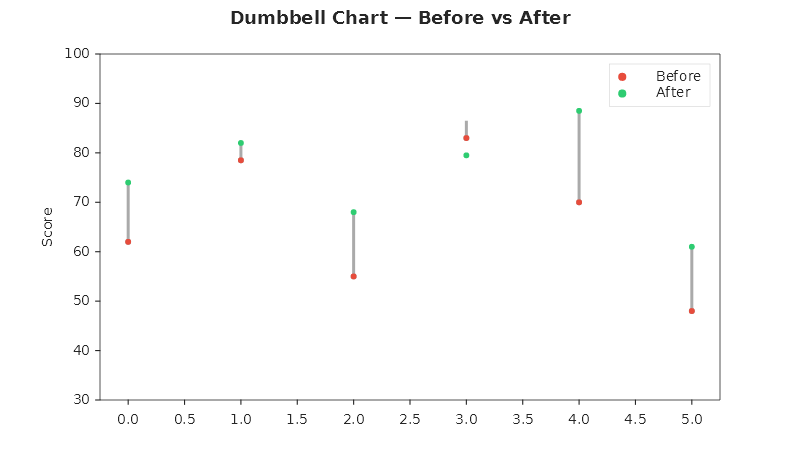
Dumbbell chart (before vs after)
// Indices 0–5: Product A–F
double[] before = [62.0, 78.5, 55.0, 83.0, 70.0, 48.0];
double[] after  = [74.0, 82.0, 68.0, 79.5, 88.5, 61.0];
double[] xIdx   = Enumerable.Range(0, before.Length).Select(i => (double)i).ToArray();
double[] zeros  = new double[before.Length];
double[] dumbDiff = before.Zip(after, (b, a) => Math.Abs(a - b)).ToArray();

Plt.Create()
    .WithTitle("Dumbbell Chart — Before vs After")
    .WithSize(800, 450)
    .AddSubPlot(1, 1, 1, ax => ax
        .ErrorBar(xIdx, before, zeros, dumbDiff, s => { s.Color = Color.FromHex("#AAAAAA"); s.LineWidth = 3; s.CapSize = 0; })
        .Scatter(xIdx, before, s => { s.Color = Color.FromHex("#E74C3C"); s.MarkerSize = 14; s.Marker = MarkerStyle.Circle; s.Label = "Before"; })
        .Scatter(xIdx, after, s => { s.Color = Color.FromHex("#2ECC71"); s.MarkerSize = 14; s.Marker = MarkerStyle.Circle; s.Label = "After"; })
        .SetYLim(30, 100)
        .SetYLabel("Score")
        .WithLegend())
    .Save("dumbbell_chart.svg");
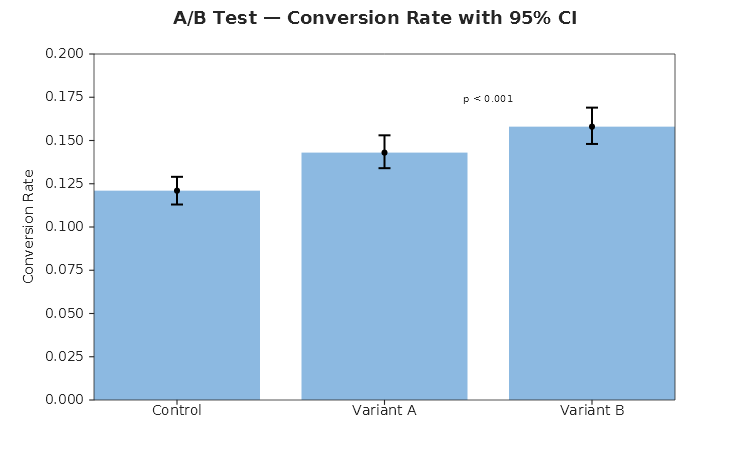
A/B test with confidence intervals
string[] variants = ["Control", "Variant A", "Variant B"];
double[] rates  = [0.121, 0.143, 0.158];
double[] errLo  = [0.008, 0.009, 0.010];
double[] errHi  = [0.008, 0.010, 0.011];
double[] xIdx   = [0.5, 1.5, 2.5];

Plt.Create()
    .WithTitle("A/B Test — Conversion Rate with 95% CI")
    .WithSize(750, 450)
    .AddSubPlot(1, 1, 1, ax => ax
        .Bar(variants, rates, s => { s.Color = Color.FromHex("#5B9BD5"); s.Alpha = 0.7; })
        .ErrorBar(xIdx, rates, errLo, errHi, s => { s.Color = Colors.Black; s.CapSize = 6; s.LineWidth = 2; })
        .Annotate("p < 0.001", 2.0, 0.172, s => s.Alignment = TextAlignment.Center)
        .SetYLabel("Conversion Rate")
        .SetYLim(0, 0.20))
    .Save("ab_test.svg");