Financial Charts
Financial dashboard template
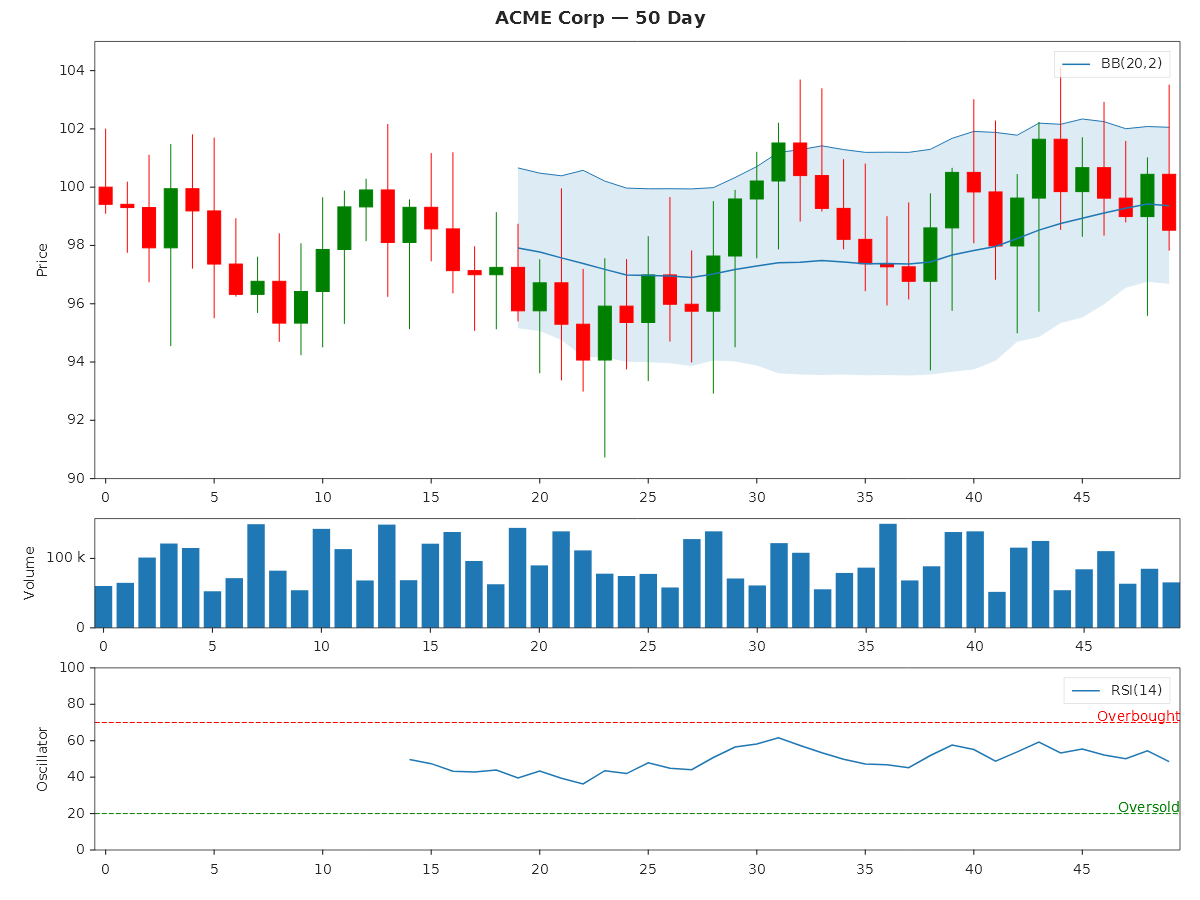
The built-in FigureTemplates.FinancialDashboard creates a 3-panel layout: price + Bollinger Bands on top, volume in the middle, and an oscillator (RSI, CCI, etc.) at the bottom.
FigureTemplates.FinancialDashboard(
        open, high, low, close, vol,
        title: "ACME Corp — 50 Day",
        configurePricePanel: ax => ax.BollingerBands(20),
        configureVolumePanel: ax => ax
            .SetYTickLocator(new MaxNLocator(3))
            .SetYTickFormatter(new EngFormatter()),
        configureOscillatorPanel: ax => ax
            .Rsi(close, 14)
            .SetYLim(0, 100)
            .AxHLine(70, l => { l.Color = Colors.Red;   l.LineStyle = LineStyle.Dashed; })
            .AxHLine(20, l => { l.Color = Colors.Green; l.LineStyle = LineStyle.Dashed; }))
    .WithSize(1200, 900)
    .Save("financial_dashboard.svg");
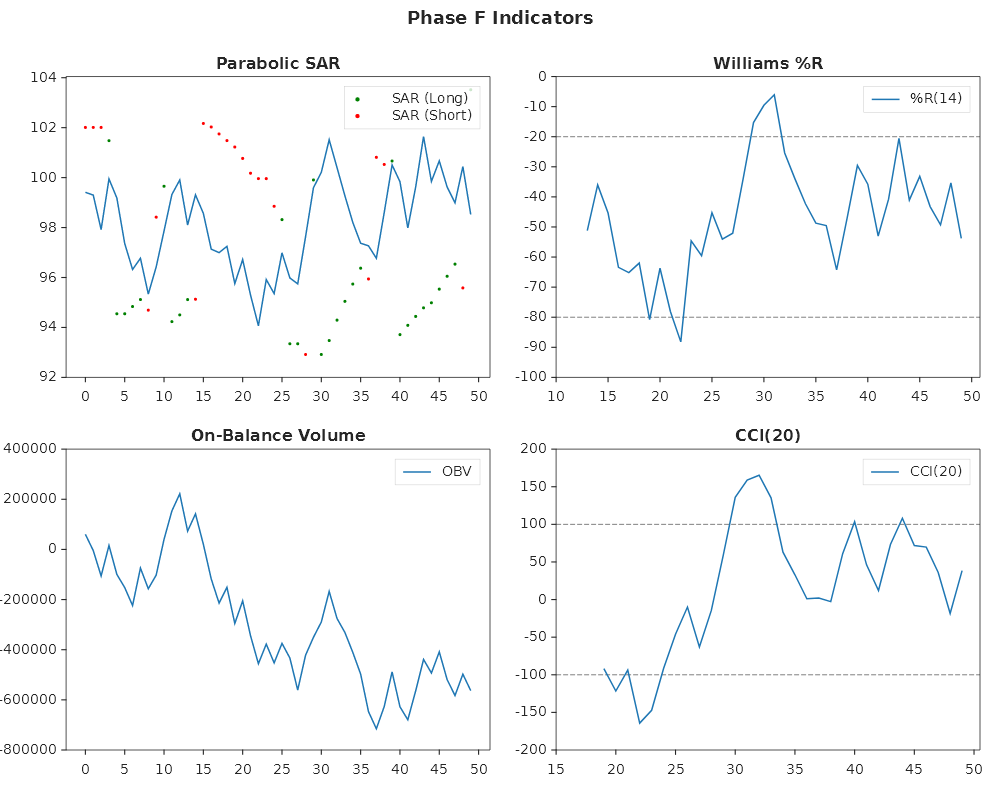
Technical indicators
Williams %R, On-Balance Volume, Parabolic SAR, and CCI:
Plt.Create()
    .WithTitle("Phase F Indicators")
    .WithSize(1000, 800)
    .WithGridSpec(2, 2)
    .TightLayout()
    .AddSubPlot(new GridPosition(0, 1, 0, 1), ax =>
    {
        ax.Plot(x, close);
        ax.ParabolicSar(high, low);
        ax.WithTitle("Parabolic SAR");
    })
    .AddSubPlot(new GridPosition(0, 1, 1, 2), ax =>
    {
        ax.WilliamsR(high, low, close, 14);
        ax.WithTitle("Williams %R");
    })
    .AddSubPlot(new GridPosition(1, 2, 0, 1), ax =>
    {
        ax.Obv(close, vol);
        ax.WithTitle("On-Balance Volume");
    })
    .AddSubPlot(new GridPosition(1, 2, 1, 2), ax =>
    {
        ax.Cci(high, low, close, 20);
        ax.WithTitle("CCI(20)");
    })
    .Save("phase_f_indicators.svg");
Relative Rotation Graph (RRG)
The RelativeRotation method renders a JdK-style 2D scatter of (RS-Ratio, RS-Momentum) per asset
vs a benchmark, with a fading tail and 100/100 quadrant grid.
Basic usage
// 104 weekly bars per asset, vs BTC benchmark
double[][] altCloses = [ethWeekly, bnbWeekly, solWeekly];
string[]   labels    = ["ETH", "BNB", "SOL"];

Plt.Create()
    .WithTitle("Crypto Rotation — Weekly DualEma(10,26)")
    .WithSize(900, 700)
    .AddSubPlot(1, 1, 1, ax => ax
        .SetXLabel("RS-Ratio")
        .SetYLabel("RS-Momentum")
        .RelativeRotation(altCloses, btcWeekly, labels, s =>
        {
            s.TailLength = 12;
            s.ColorMap   = ColorMaps.Tab10;
        }))
    .Save("rrg_crypto.svg");
With absorption + ENB overlays
When portfolio-level absorption ratio and ENB (Effective Number of Bets) are available, pass them as overlays so each dot on the trail encodes market-stress information directly:
// absorption[t] ∈ [0..1]: 0 = diversified (green), 1 = panic (red)
// enb[t]: larger = more diversified portfolio; radius ∝ ENB
double[] absorption = absorptionTimeSeries.AbsorptionRatio;
double[] enb        = absorptionTimeSeries.Enb;

Plt.Create()
    .WithTitle("Rotation + Risk Overlay")
    .WithSize(900, 700)
    .AddSubPlot(1, 1, 1, ax => ax
        .RelativeRotation(altCloses, btcWeekly, labels, s =>
        {
            s.AbsorptionRatioPerBar = absorption;
            s.EnbPerBar             = enb;
            s.TailLength            = 12;
        }))
    .Save("rrg_with_overlays.svg");
Visual encoding:
- Dot fill maps through RdYlGn reversed: green (low absorption) → red (high absorption / panic)
- Asset colour becomes the edge ring of each dot
- Dot radius =
max(1.5, enb × 1.5)px; head dot 1.5× larger than trail dots - Gray ghost trail is drawn behind the per-point circles
Formula selection
// ZScore formula for equities-vs-index RRGs
ax.RelativeRotation(closes, benchmark, labels, s =>
{
    s.Formula          = RrgFormula.ZScore;
    s.ShortPeriod      = 14;   // rolling z-score window
    s.MomentumLookback = 14;   // ROC lookback before z-scoring momentum
});
See RelativeRotationSeries for minimum data requirements per formula.