Geographic Maps
Requires:
dotnet add package MatPlotLibNet.Geo
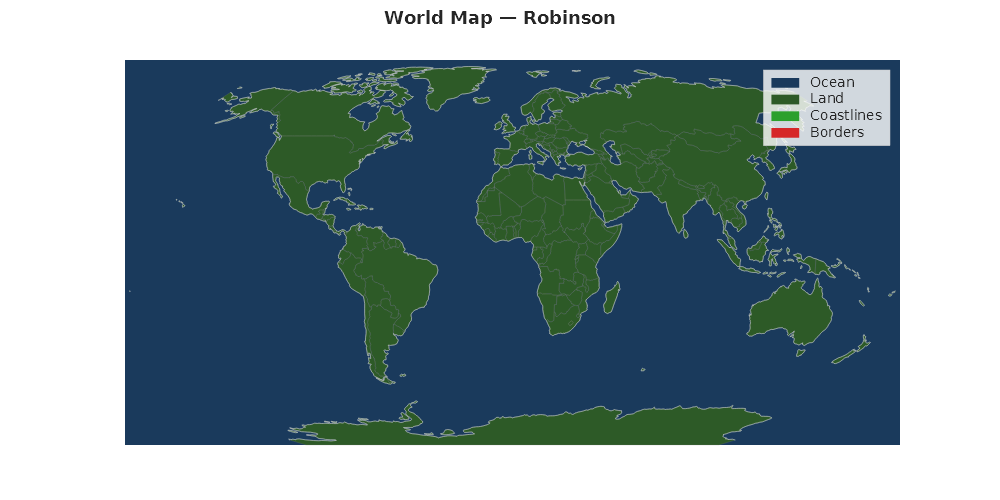
World map with coastlines (Robinson)
using MatPlotLibNet;
using MatPlotLibNet.Geo;
using MatPlotLibNet.Geo.Projections;

Plt.Create()
    .WithTitle("World — Robinson Projection")
    .WithSize(1000, 500)
    .AddSubPlot(1, 1, 1, ax => ax
        .WithProjection(GeoProjection.Robinson)
        .Coastlines(GeoProjection.Robinson)
        .Borders(GeoProjection.Robinson))
    .Save("world_robinson.svg");
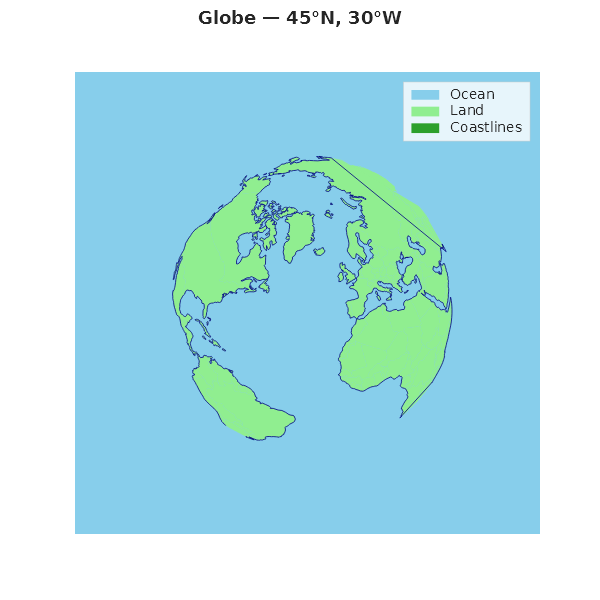
Globe view (Orthographic)
Center the globe on any point with OrthographicAt(lat, lon):
var proj = GeoProjection.OrthographicAt(45, -30);

Plt.Create()
    .WithTitle("Globe — 45°N, 30°W")
    .WithSize(600, 600)
    .AddSubPlot(1, 1, 1, ax => ax
        .WithProjection(proj)
        .Ocean(proj, Colors.LightBlue)
        .Land(proj, Colors.LightGreen)
        .Coastlines(proj, Colors.DarkBlue, lineWidth: 0.8)
        .Borders(proj, Colors.Gray, lineWidth: 0.3))
    .Save("globe.svg");
Full-featured world map (Mollweide)
Combine Land(), Ocean(), Coastlines(), and Borders() for a complete map:
var proj = GeoProjection.Mollweide;

Plt.Create()
    .WithTitle("Equal-Area World Map — Mollweide")
    .WithSize(1000, 500)
    .WithTheme(Theme.Dark)
    .AddSubPlot(1, 1, 1, ax => ax
        .WithProjection(proj)
        .Ocean(proj, Color.FromHex("#1a3a5c"))
        .Land(proj, Color.FromHex("#2d5a27"))
        .Coastlines(proj, Colors.White, lineWidth: 0.5)
        .Borders(proj, Color.FromHex("#888888"), lineWidth: 0.2))
    .Save("mollweide_full.svg");
Centered projections
Several projections accept center coordinates:
// Orthographic centered on Tokyo
var tokyo = GeoProjection.OrthographicAt(centerLat: 35.7, centerLon: 139.7);

// Stereographic centered on the North Pole
var northPole = GeoProjection.StereographicAt(centerLat: 90, centerLon: 0);

// Azimuthal equidistant centered on London
var london = GeoProjection.AzimuthalEquidistantAt(centerLat: 51.5, centerLon: -0.1);

// Transverse Mercator with custom central meridian
var utmZone33 = GeoProjection.TransverseMercatorAt(centerLon: 15);

// Albers Equal Area with custom standard parallels (US map)
var us = GeoProjection.AlbersEqualAreaWith(sp1: 29.5, sp2: 45.5, centerLon: -96, centerLat: 37.5);

// Lambert Conformal with custom standard parallels
var europe = GeoProjection.LambertConformalWith(sp1: 35, sp2: 65, centerLon: 10, centerLat: 52);
Projection comparison (2×2 grid)
var projections = new (string Name, IGeoProjection Proj)[]
{
    ("Robinson", GeoProjection.Robinson),
    ("Mollweide", GeoProjection.Mollweide),
    ("Natural Earth", GeoProjection.NaturalEarth),
    ("Equal Earth", GeoProjection.EqualEarth),
};

var builder = Plt.Create()
    .WithTitle("Projection Comparison")
    .WithSize(1200, 800);

for (int i = 0; i < 4; i++)
{
    var (name, proj) = projections[i];
    builder.AddSubPlot(2, 2, i + 1, ax => ax
        .WithProjection(proj)
        .Coastlines(proj, Colors.DarkBlue, lineWidth: 0.6)
        .Land(proj, Colors.Wheat)
        .WithTitle(name));
}

builder.TightLayout().Save("projection_comparison.svg");
Coastline and border styling
Fine-tune line appearance with color and lineWidth parameters:
var proj = GeoProjection.Robinson;

Plt.Create()
    .AddSubPlot(1, 1, 1, ax => ax
        .WithProjection(proj)
        // Thick coastlines in dark blue
        .Coastlines(proj, color: Colors.Navy, lineWidth: 1.2)
        // Thin borders in light gray
        .Borders(proj, color: Colors.LightGray, lineWidth: 0.15))
    .Save("styled_borders.svg");
Loading custom GeoJSON
Use GeoJsonReader.Parse() to load your own GeoJSON files:
using MatPlotLibNet.Geo.GeoJson;
using MatPlotLibNet.Geo.Series;

string json = File.ReadAllText("my_regions.geojson");
List<GeoFeature> features = GeoJsonReader.Parse(json);

var proj = GeoProjection.Robinson;

// Access feature properties
foreach (var feature in features)
{
    string name = feature.Properties["NAME"];
    Console.WriteLine($"Feature: {name}, Type: {feature.Geometry.Type}");
}

// Add custom features as a GeoPolygonSeries
var series = new GeoPolygonSeries(proj)
{
    Color = Colors.CornflowerBlue,
    StrokeColor = Colors.DarkBlue,
    StrokeWidth = 0.5,
    Label = "My Regions"
};
series.Features.AddRange(features);
Edge handling
MatPlotLibNet handles common geographic edge cases automatically:
using MatPlotLibNet.Geo.GeoJson;

// Russia crosses the antimeridian (dateline) — automatically split
var proj = GeoProjection.Robinson;

Plt.Create()
    .WithTitle("Dateline Handling — Russia renders correctly")
    .AddSubPlot(1, 1, 1, ax => ax
        .WithProjection(proj)
        .Land(proj, Colors.LightGreen)
        .Coastlines(proj))
    .Save("dateline.svg");

// The GeoClipping utility handles edge cases:
// - SplitAtDateline()  — splits polygons crossing ±180° longitude
// - FilterNaN()        — removes NaN points from projected coordinates
// - ClipToBounds()     — clips to projection boundary
Embedded data — Natural Earth 110m
MatPlotLibNet.Geo ships with embedded Natural Earth 110m data (no internet required):
using MatPlotLibNet.Geo.Data;

// 134 coastline features (LineString geometries)
var coastlines = NaturalEarth110m.Coastlines();

// 177 country features (Polygon geometries with properties)
var countries = NaturalEarth110m.Countries();

// Access country properties
foreach (var country in countries)
{
    if (country.Properties.TryGetValue("NAME", out var name))
        Console.WriteLine(name);
}
Available projections (13 total)
| Projection | API | Use case |
|---|---|---|
| PlateCarree | GeoProjection.PlateCarree |
Simple equirectangular |
| Mercator | GeoProjection.Mercator |
Web maps |
| Robinson | GeoProjection.Robinson |
World maps (compromise) |
| Orthographic | GeoProjection.OrthographicAt(lat, lon) |
Globe view |
| Lambert Conformal | GeoProjection.LambertConformalWith(sp1, sp2, ...) |
Mid-latitude regions |
| Mollweide | GeoProjection.Mollweide |
Global equal-area |
| Sinusoidal | GeoProjection.Sinusoidal |
Simple equal-area |
| Albers Equal Area | GeoProjection.AlbersEqualAreaWith(sp1, sp2, ...) |
US / continental maps |
| Azimuthal Equidistant | GeoProjection.AzimuthalEquidistantAt(lat, lon) |
Polar / aviation |
| Stereographic | GeoProjection.StereographicAt(lat, lon) |
Polar regions |
| Transverse Mercator | GeoProjection.TransverseMercatorAt(lon) |
UTM zones |
| Natural Earth | GeoProjection.NaturalEarth |
World maps (smooth) |
| Equal Earth | GeoProjection.EqualEarth |
Modern equal-area |
Fluent API reference
| Method | Parameters | Description |
|---|---|---|
.WithProjection(proj) |
IGeoProjection |
Set projection, hide axes chrome |
.Coastlines(proj, ...) |
color?, lineWidth (0.5) |
Natural Earth 110m coastlines |
.Borders(proj, ...) |
color?, lineWidth (0.3) |
Natural Earth 110m country borders |
.Ocean(proj, color) |
Color |
Fill ocean areas |
.Land(proj, color) |
Color |
Fill land areas |
GeoJsonReader.Parse(json) |
string |
Parse custom GeoJSON FeatureCollection |
NaturalEarth110m.Coastlines() |
— | 134 coastline features |
NaturalEarth110m.Countries() |
— | 177 country polygon features |
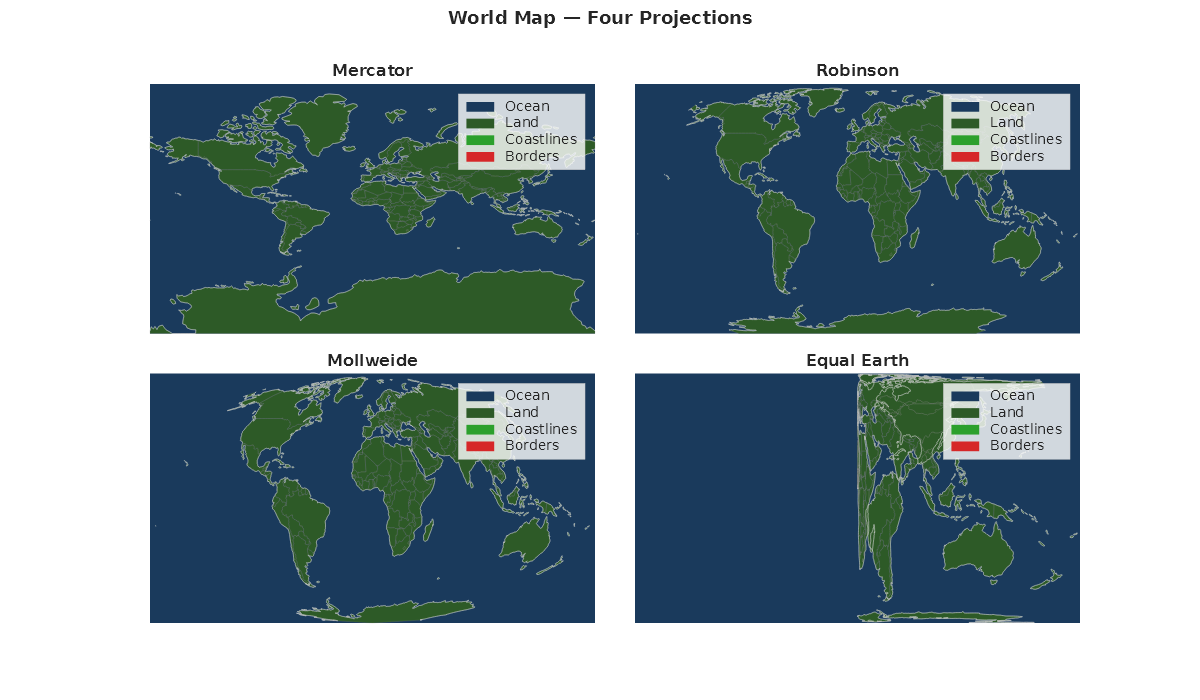
Four-projection comparison
Render the same world dataset under four different projections in a 2 × 2 grid.
var projections = new (string Name, IGeoProjection Proj)[]
{
    ("Mercator",    GeoProjection.Mercator),
    ("Robinson",    GeoProjection.Robinson),
    ("Mollweide",   GeoProjection.Mollweide),
    ("Equal Earth", GeoProjection.EqualEarth),
};

var fig = Plt.Create().WithTitle("Four Projections").WithSize(1200, 700);
for (int i = 0; i < projections.Length; i++)
{
    var (name, proj) = projections[i];
    fig.AddSubPlot(2, 2, i + 1, ax => ax
        .WithTitle(name)
        .WithProjection(proj)
        .Ocean(proj, Color.FromHex("#1a3a5c"))
        .Land(proj, Color.FromHex("#2d5a27"))
        .Coastlines(proj, Colors.White, lineWidth: 0.5)
        .Borders(proj, Color.FromHex("#888888"), lineWidth: 0.2));
}
fig.Save("geo_projection_grid.svg");
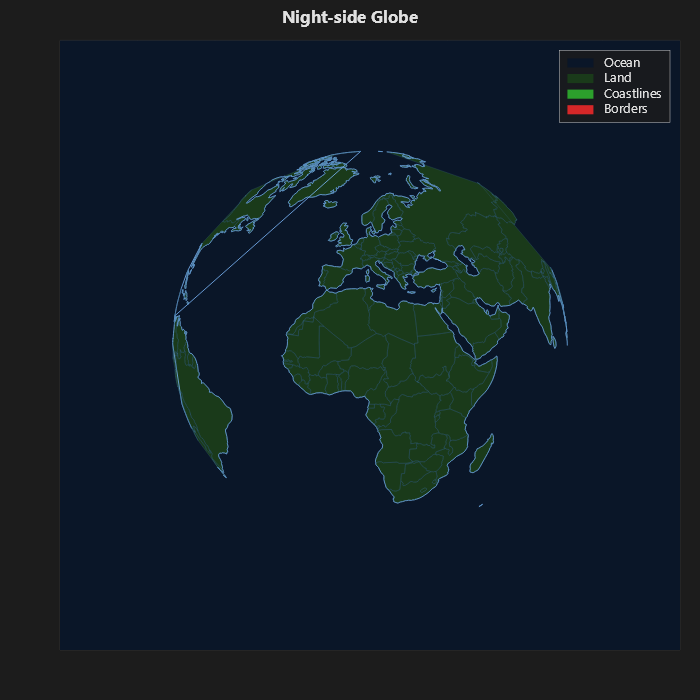
Night-side globe
Dark ocean, muted land, glowing coastlines using Theme.Dark and OrthographicAt.
var proj = GeoProjection.OrthographicAt(20, 10);

Plt.Create()
    .WithTitle("Night-side Globe")
    .WithSize(700, 700)
    .WithTheme(Theme.Dark)
    .AddSubPlot(1, 1, 1, ax => ax
        .WithProjection(proj)
        .Ocean(proj, Color.FromHex("#0a1628"))
        .Land(proj, Color.FromHex("#1a3a1a"))
        .Coastlines(proj, Color.FromHex("#7fbbff"), lineWidth: 0.8)
        .Borders(proj, Color.FromHex("#3a6a8a"), lineWidth: 0.25))
    .Save("geo_nightside.svg");