Line Charts
Tips: Try
.WithBrowserInteraction()to make your line chart zoomable in the browser. Use.WithSymlogYScale()for data spanning large ranges. Switch themes with.WithTheme(Theme.Nord).
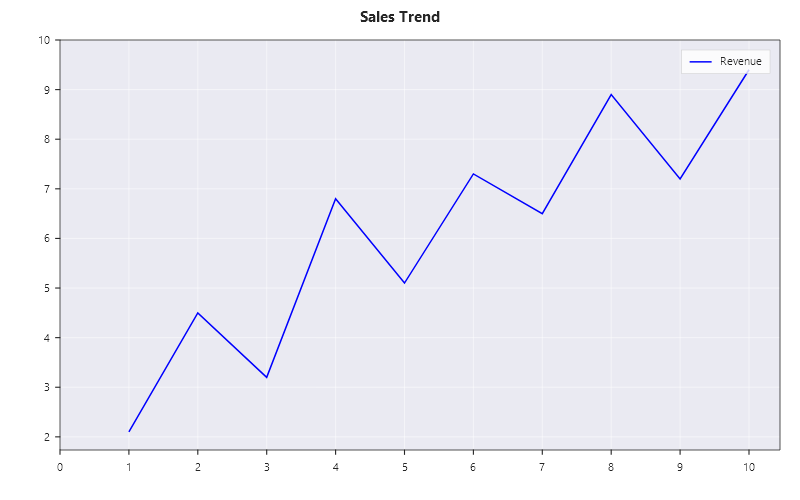
Simple line chart
double[] x = [1, 2, 3, 4, 5, 6, 7, 8, 9, 10];
double[] y = [2.1, 4.5, 3.2, 6.8, 5.1, 7.3, 6.5, 8.9, 7.2, 9.4];

Plt.Create()
    .WithTitle("Sales Trend")
    .WithTheme(Theme.Seaborn)
    .WithSize(800, 500)
    .Plot(x, y, line => { line.Color = Colors.Blue; line.Label = "Revenue"; })
    .Save("chart.svg");
Line styles, markers, and width
Customize every aspect of the line via the configure lambda:
Plt.Create()
    .WithTitle("Line Styles")
    .AddSubPlot(1, 1, 1, ax =>
    {
        ax.Plot(x, y1, s =>
        {
            s.Color = Colors.Blue;
            s.LineStyle = LineStyle.Solid;
            s.LineWidth = 2.0;
            s.Label = "Solid (2px)";
        });
        ax.Plot(x, y2, s =>
        {
            s.Color = Colors.Red;
            s.LineStyle = LineStyle.Dashed;
            s.LineWidth = 1.5;
            s.Label = "Dashed";
        });
        ax.Plot(x, y3, s =>
        {
            s.Color = Colors.Green;
            s.LineStyle = LineStyle.DashDot;
            s.LineWidth = 1.0;
            s.Marker = MarkerStyle.Circle;
            s.MarkerSize = 6;
            s.MarkEvery = 2;  // marker every 2nd point
            s.Label = "DashDot + markers";
        });
        ax.WithLegend(LegendPosition.UpperLeft);
    })
    .Save("line_styles.svg");
Smooth interpolation
Fritsch-Carlson cubic spline for smooth curves:
Plt.Create()
    .AddSubPlot(1, 1, 1, ax => ax
        .Plot(x, y, s =>
        {
            s.Smooth = true;
            s.SmoothResolution = 20;  // 20 sub-points per interval
            s.Color = Colors.Purple;
            s.Label = "Smoothed";
        })
        .Scatter(x, y, s =>
        {
            s.Color = Colors.Red;
            s.MarkerSize = 8;
            s.Label = "Data points";
        })
        .WithLegend())
    .Save("smooth_line.svg");
Step functions
Control step placement with DrawStyle:
Plt.Create()
    .WithSize(900, 400)
    .AddSubPlot(1, 3, 1, ax => ax
        .Plot(x, y, s => { s.DrawStyle = DrawStyle.Steps; s.Label = "Steps"; })
        .WithTitle("Steps").WithLegend())
    .AddSubPlot(1, 3, 2, ax => ax
        .Plot(x, y, s => { s.DrawStyle = DrawStyle.StepPre; s.Label = "StepPre"; })
        .WithTitle("StepPre").WithLegend())
    .AddSubPlot(1, 3, 3, ax => ax
        .Plot(x, y, s => { s.DrawStyle = DrawStyle.StepMid; s.Label = "StepMid"; })
        .WithTitle("StepMid").WithLegend())
    .TightLayout()
    .Save("step_styles.svg");
Marker customization
Plt.Create()
    .AddSubPlot(1, 1, 1, ax => ax
        .Plot(x, y, s =>
        {
            s.Marker = MarkerStyle.Diamond;
            s.MarkerSize = 10;
            s.MarkerFaceColor = Colors.Gold;
            s.MarkerEdgeColor = Colors.DarkRed;
            s.MarkerEdgeWidth = 1.5;
            s.Color = Colors.DarkRed;
            s.Label = "Diamond markers";
        })
        .WithLegend())
    .Save("marker_custom.svg");
All marker shapes (v1.7.2 Phase M)
MarkerStyle exposes 13 shapes, every one drawn by the shared MarkerRenderer:
| Shape | SVG primitive | Notes |
|---|---|---|
Circle |
<circle> |
Default. Radius = MarkerSize / 2. |
Square |
<rect> |
Edge = MarkerSize. |
Triangle / TriangleDown / TriangleLeft / TriangleRight |
<polygon> (3 vertices) |
Equilateral; orientation as named. |
Diamond |
<polygon> (4 vertices) |
Square rotated 45°. |
Pentagon / Hexagon |
<polygon> (5 / 6 vertices) |
Regular N-gon, flat-top-up variant. |
Star |
<polygon> (10 vertices) |
5-point star, inner radius ≈ 0.38 × outer (matplotlib parity). |
Cross / Plus |
<line> × 2 |
Outline-only (no fill). Stroke thickness falls back to MarkerSize / 8 when MarkerEdgeWidth is zero. |
None |
— | No marker drawn. |
Prior to v1.7.2 Phase M, line charts drew every marker as a circle and scatter plots honoured only Square; all other shapes silently collapsed to circles. The shared MarkerRenderer dispatches all shapes uniformly across both series types.
Grid and spine control
Plt.Create()
    .AddSubPlot(1, 1, 1, ax => ax
        .Plot(x, y, s => s.Label = "Data")
        // Grid styling
        .WithGrid(g => g with
        {
            Color = Colors.LightGray,
            LineStyle = LineStyle.Dotted,
            LineWidth = 0.5,
            Alpha = 0.8
        })
        // Hide top and right spines (matplotlib style)
        .HideTopSpine()
        .HideRightSpine()
        // Axis ranges
        .SetXLim(0, 12)
        .SetYLim(0, 12)
        .SetXLabel("Time (s)")
        .SetYLabel("Amplitude")
        .WithLegend())
    .Save("grid_spines.svg");
Secondary Y-axis
Plot two datasets with different scales on the same axes:
Plt.Create()
    .AddSubPlot(1, 1, 1, ax => ax
        .Plot(x, temperature, s => { s.Color = Colors.Red; s.Label = "Temperature (°C)"; })
        .SetYLabel("Temperature (°C)")
        .WithSecondaryYAxis(sec =>
        {
            sec.Plot(x, pressure, s => { s.Color = Colors.Blue; s.Label = "Pressure (hPa)"; });
            sec.SetYLabel("Pressure (hPa)");
        })
        .WithLegend())
    .Save("dual_axis.svg");
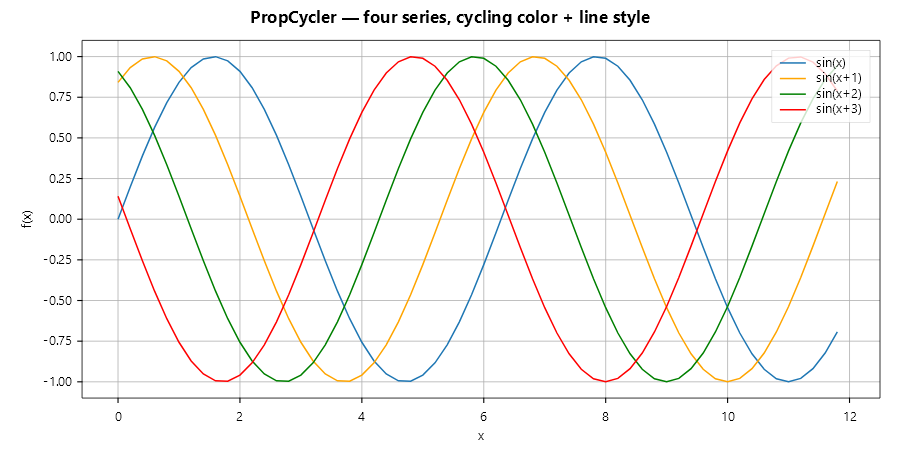
PropCycler — automatic color + line style cycling
When plotting multiple series, PropCycler automatically assigns distinct colors and line styles:
var cycler = new PropCyclerBuilder()
    .WithColors(Colors.Tab10Blue, Colors.Orange, Colors.Green, Colors.Red)
    .WithLineStyles(LineStyle.Solid, LineStyle.Dashed, LineStyle.Dotted, LineStyle.DashDot)
    .Build();

double[] x = Enumerable.Range(0, 60).Select(i => i * 0.2).ToArray();

Plt.Create()
    .WithTitle("PropCycler — four series, cycling color + line style")
    .WithTheme(Theme.CreateFrom(Theme.Default).WithPropCycler(cycler).Build())
    .AddSubPlot(1, 1, 1, ax =>
    {
        ax.Plot(x, x.Select(v => Math.Sin(v)).ToArray(),       s => s.Label = "sin(x)");
        ax.Plot(x, x.Select(v => Math.Sin(v + 1.0)).ToArray(), s => s.Label = "sin(x+1)");
        ax.Plot(x, x.Select(v => Math.Sin(v + 2.0)).ToArray(), s => s.Label = "sin(x+2)");
        ax.Plot(x, x.Select(v => Math.Sin(v + 3.0)).ToArray(), s => s.Label = "sin(x+3)");
        ax.WithLegend(LegendPosition.UpperRight);
    })
    .TightLayout()
    .Save("prop_cycler.svg");
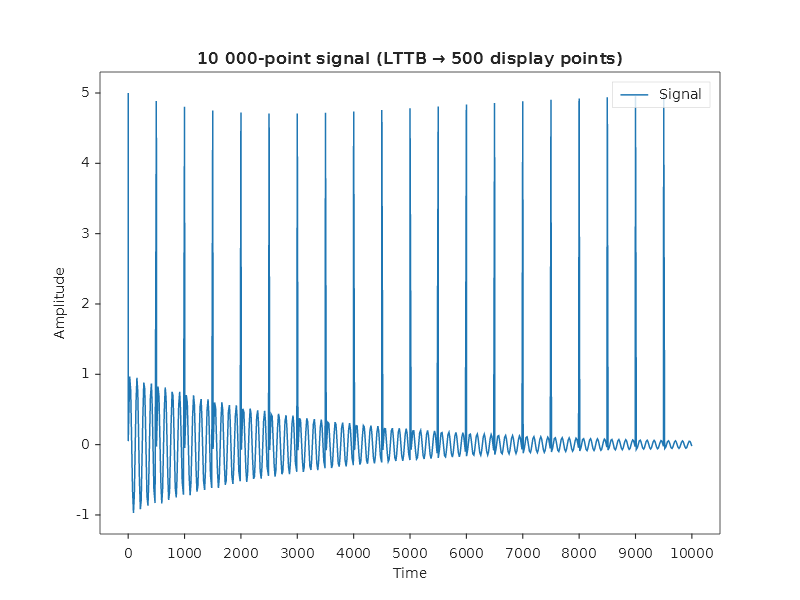
LTTB downsampling for large datasets
Display 10,000 points as 500 using the Largest-Triangle-Three-Buckets algorithm:
double[] x = Enumerable.Range(0, 10_000).Select(i => (double)i).ToArray();
double[] y = x.Select(v => Math.Sin(v * 0.05) * Math.Exp(-v * 0.0003)).ToArray();

Plt.Create()
    .AddSubPlot(1, 1, 1, ax => ax
        .WithTitle("10 000-point signal (LTTB → 500 display points)")
        .Plot(x, y, line => { line.Label = "Signal"; })
        .WithDownsampling(500))
    .Save("lttb.svg");
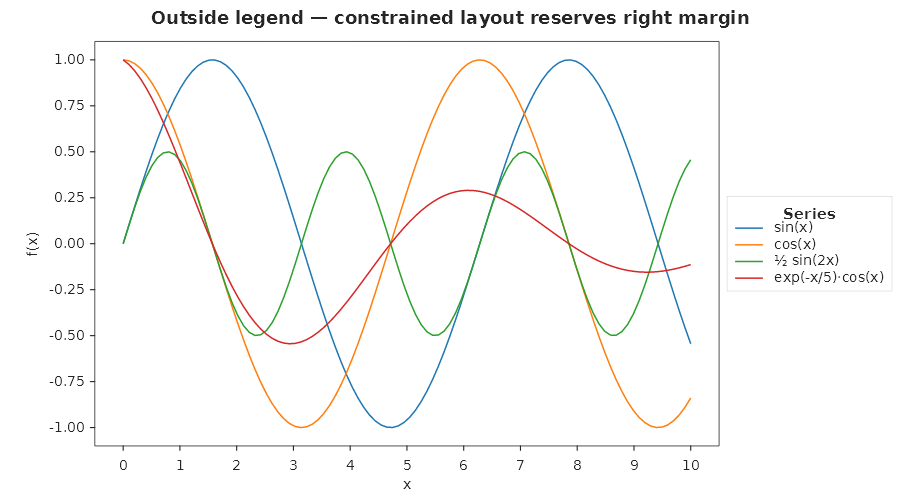
Outside legend
Place the legend outside the plot area — the constrained-layout engine reserves margin space automatically:
Plt.Create()
    .WithSize(900, 500)
    .TightLayout()
    .AddSubPlot(1, 1, 1, ax =>
    {
        ax.Plot(x, x.Select(v => Math.Sin(v)).ToArray(), s => s.Label = "sin(x)");
        ax.Plot(x, x.Select(v => Math.Cos(v)).ToArray(), s => s.Label = "cos(x)");
        ax.WithLegend(l => l with { Position = LegendPosition.OutsideRight, Title = "Series" });
    })
    .Save("legend_outside.svg");
Legend customization
ax.WithLegend(l => l with
{
    Position = LegendPosition.UpperRight,
    NCols = 2,               // two-column layout
    FontSize = 10,
    Title = "Metrics",
    TitleFontSize = 12,
    FrameOn = true,
    FancyBox = true,          // rounded corners
    Shadow = true,
    FaceColor = Colors.AliceBlue,
    EdgeColor = Colors.SteelBlue,
    FrameAlpha = 0.9,
    MarkerScale = 1.5,
    LabelSpacing = 0.4,
    ColumnSpacing = 1.5,
});
Legend value display
WithLegendValues() appends each labelled XY series' last Y value to its legend
entry — useful for live or snapshot charts where the current reading matters as much
as the series name. The value is formatted as F2 with InvariantCulture (always a
decimal dot, never a locale comma).
double[] x = Enumerable.Range(0, 60).Select(i => (double)i).ToArray();

Plt.Create()
    .AddSubPlot(1, 1, 1, ax => ax
        .Plot(x, x.Select(v => Math.Sin(v * 0.2)).ToArray(),        s => s.Label = "sin")
        .Plot(x, x.Select(v => Math.Cos(v * 0.2)).ToArray(),        s => s.Label = "cos")
        .WithLegendValues()   // legend shows e.g. "sin = −0.44"  "cos = 0.90"
        .WithLegend(LegendPosition.UpperRight))
    .Save("legend_values.svg");
The result is legend entries like "sin = −0.44" and "cos = 0.90" — the suffix
updates automatically if you rebuild the figure with fresh data.
Combine with the transform-based WithLegend(...) overload for full control over
layout while keeping the value suffix:
Plt.Create()
    .AddSubPlot(1, 1, 1, ax => ax
        .Plot(x, y1, s => s.Label = "Alpha")
        .Plot(x, y2, s => s.Label = "Beta")
        .WithLegendValues()
        .WithLegend(l => l with { Position = LegendPosition.OutsideRight, Title = "Channel" }))
    .Save("legend_values_outside.svg");
Series eligibility. Only XYSeries descendants (line, scatter, signal, sparkline…)
contribute a value. Categorical series (bar, pie, treemap…) render their label text
only — the suffix is silently skipped for them. Unlabelled series never appear in the
legend regardless.
Disabling. Pass false to opt back out: .WithLegendValues(false).
Fluent API reference — LineSeries
| Property | Type | Default | Description |
|---|---|---|---|
Color |
Color |
auto | Line color |
LineStyle |
LineStyle |
Solid |
Solid, Dashed, Dotted, DashDot |
LineWidth |
double |
1.5 |
Line width in pixels |
Marker |
MarkerStyle |
none | Circle, Square, Triangle, Diamond, Star, Cross, Plus, ... |
MarkerSize |
double |
6 |
Marker diameter |
MarkerFaceColor |
Color |
auto | Marker fill color |
MarkerEdgeColor |
Color |
auto | Marker edge color |
MarkerEdgeWidth |
double |
1 |
Marker edge width |
MarkEvery |
int |
1 |
Show marker every N points |
DrawStyle |
DrawStyle |
Default |
Default, Steps, StepPre, StepMid, StepPost |
Smooth |
bool |
false |
Fritsch-Carlson cubic interpolation |
SmoothResolution |
int |
10 |
Sub-points per interval when smoothing |
Label |
string |
none | Legend label |
Visible |
bool |
true |
Show/hide series |
ZOrder |
int |
0 |
Render order (higher = on top) |
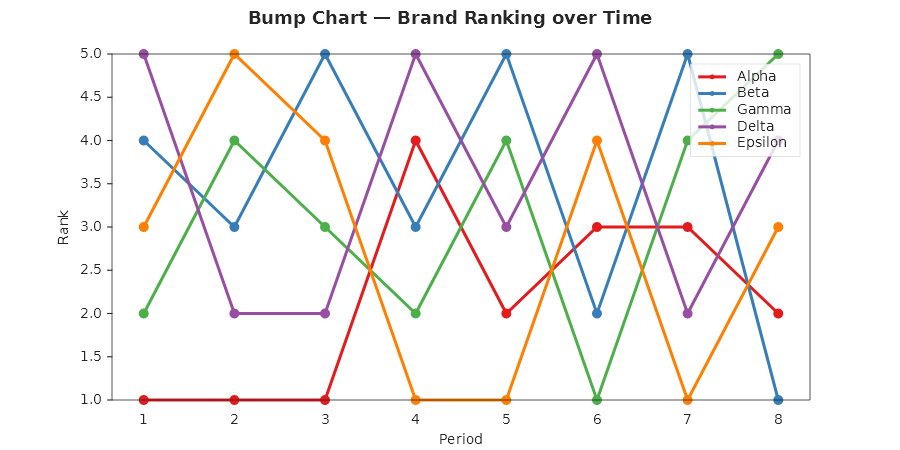
Bump / rank chart
Invert the Y axis so rank 1 is at the top. Use SetYLim(n + 0.5, 0.5) to flip the scale.
var rng = new Random(99);
string[] brands = ["Alpha", "Beta", "Gamma", "Delta", "Epsilon"];
int periods = 8;
double[] xPeriods = Enumerable.Range(1, periods).Select(i => (double)i).ToArray();
var palette = new[] { "#E41A1C", "#377EB8", "#4DAF4A", "#984EA3", "#FF7F00" };

int[][] ranks = Enumerable.Range(0, brands.Length).Select(_ => new int[periods]).ToArray();
for (int p = 0; p < periods; p++)
{
    int[] perm = Enumerable.Range(1, brands.Length).OrderBy(_ => rng.Next()).ToArray();
    for (int b = 0; b < brands.Length; b++) ranks[b][p] = perm[b];
}

Plt.Create()
    .WithTitle("Bump Chart — Brand Ranking over Time")
    .WithSize(900, 450)
    .AddSubPlot(1, 1, 1, ax =>
    {
        for (int b = 0; b < brands.Length; b++)
        {
            double[] y = ranks[b].Select(r => (double)r).ToArray();
            ax.Plot(xPeriods, y, s => { s.Color = Color.FromHex(palette[b]); s.LineWidth = 3; s.Marker = MarkerStyle.Circle; s.MarkerSize = 10; s.Label = brands[b]; });
        }
        ax.SetYLim(brands.Length + 0.5, 0.5); // invert: rank 1 at top
        ax.SetYLabel("Rank");
        ax.WithLegend();
    })
    .Save("bump_chart.svg");