Math Text
MatPlotLibNet supports LaTeX-like inline math in any label, title, or annotation. Wrap expressions in $...$.
Greek letters and super/subscript
Plt.Create()
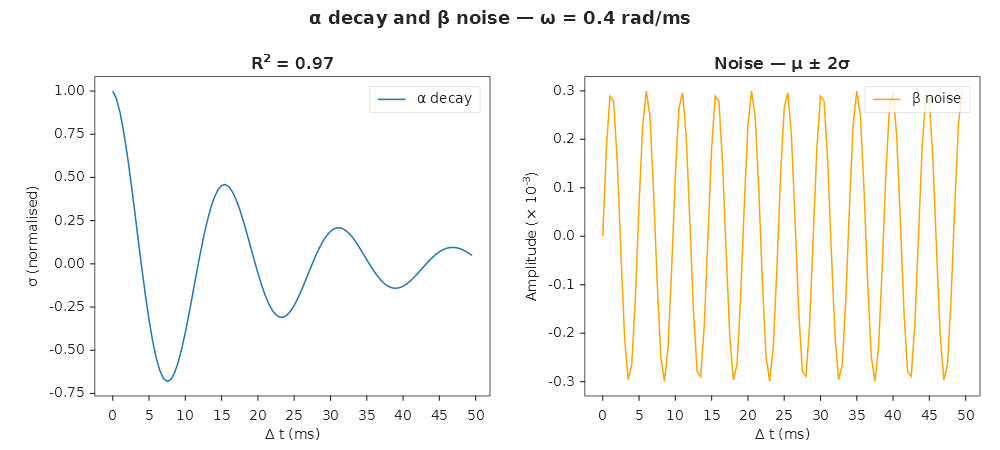
.WithTitle(@"$\alpha$ decay and $\beta$ noise — $\omega = 0.4$ rad/ms")
.AddSubPlot(1, 2, 1, ax => ax
.WithTitle(@"R$^{2}$ = 0.97")
.SetXLabel(@"$\Delta t$ (ms)")
.SetYLabel(@"$\sigma$ (normalised)")
.Plot(t, decay, line => { line.Label = @"$\alpha$ decay"; })
.WithLegend(LegendPosition.UpperRight))
.AddSubPlot(1, 2, 2, ax => ax
.WithTitle(@"Noise — $\mu \pm 2\sigma$")
.SetXLabel(@"$\Delta t$ (ms)")
.SetYLabel(@"Amplitude ($\times 10^{-3}$)")
.Plot(t, noise, line => { line.Label = @"$\beta$ noise"; })
.WithLegend(LegendPosition.UpperRight))
.TightLayout()
.Save("math_text.svg");
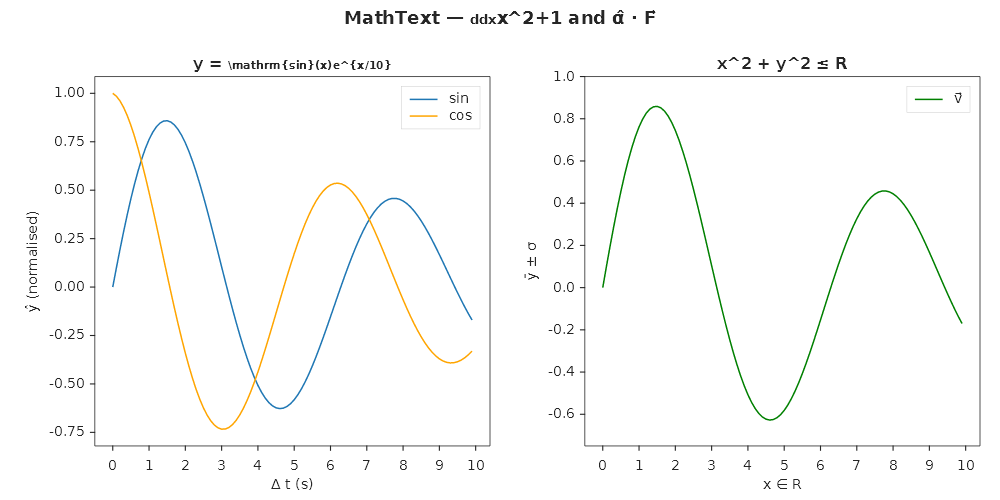
Fractions, square roots, accents, font variants (v1.3.0)
Plt.Create()
    .WithTitle(@"MathText — $\frac{d}{dx}\sqrt{x^2+1}$ and $\hat{\alpha} \cdot \vec{F}$")
    .AddSubPlot(1, 2, 1, ax => ax
        .WithTitle(@"$\mathbf{y} = \frac{\mathrm{sin}(x)}{e^{x/10}}$")
        .SetXLabel(@"$\Delta t$ (s)")
        .SetYLabel(@"$\hat{y}$ (normalised)")
        .Plot(x, y1, s => { s.Label = @"$\mathrm{sin}$"; })
        .Plot(x, y2, s => { s.Label = @"$\mathrm{cos}$"; })
        .WithLegend(LegendPosition.UpperRight))
    .AddSubPlot(1, 2, 2, ax => ax
        .WithTitle(@"$\sqrt{x^2 + y^2} \leq \mathbb{R}$")
        .SetXLabel(@"$x \in \mathbb{R}$")
        .SetYLabel(@"$\bar{y} \pm \sigma$")
        .Plot(x, y1, s => { s.Label = @"$\vec{v}$"; })
        .WithLegend(LegendPosition.UpperRight))
    .TightLayout()
    .Save("math_text_v130.svg");
Operator limits — integrals, sums, products (v1.7.0)
Sub/superscripts on large operators render as limits (above/below):
Plt.Create()
    .WithTitle(@"$\sum_{i=0}^{n} \frac{1}{i!} = e$ — Taylor expansion")
    .AddSubPlot(1, 1, 1, ax => ax
        .SetXLabel(@"$\int_a^b f(x)\,dx$")
        .SetYLabel(@"$\prod_{k=1}^{N} (1 + r_k)$")
        .Plot(x, y, s => s.Label = @"$e^{-\lambda t}$")
        .WithLegend())
    .Save("operator_limits.svg");
Supported large operators
| LaTeX | Renders | Example |
|---|---|---|
\int_a^b |
∫ with limits above/below | $\int_0^{\infty} e^{-x}\,dx$ |
\iint |
∬ | $\iint_D f\,dA$ |
\iiint |
∭ | $\iiint_V f\,dV$ |
\oint |
∮ | $\oint_C \vec{F} \cdot d\vec{r}$ |
\sum_{i=0}^{n} |
Σ with limits | $\sum_{i=1}^{n} x_i$ |
\prod_{k=1}^{N} |
Π with limits | $\prod_{k=1}^{N} a_k$ |
\lim_{x \to 0} |
lim with subscript below | $\lim_{n \to \infty} a_n$ |
\max, \min |
max/min with subscript | $\max_{x \in S} f(x)$ |
Matrices (v1.7.0)
Plt.Create()
    .WithTitle(@"$\begin{pmatrix} a & b \\ c & d \end{pmatrix} \cdot \vec{x} = \vec{b}$")
    .AddSubPlot(1, 1, 1, ax => ax
        .SetXLabel(@"$\begin{bmatrix} 1 & 0 \\ 0 & 1 \end{bmatrix}$")
        .Plot(x, y))
    .Save("matrix_labels.svg");
Supported matrix environments
| Environment | Delimiters | Example | ||
|---|---|---|---|---|
matrix |
None | $\begin{matrix} a & b \\ c & d \end{matrix}$ |
||
pmatrix |
Parentheses ( ) | $\begin{pmatrix} 1 & 2 \\ 3 & 4 \end{pmatrix}$ |
||
bmatrix |
Brackets [ ] | $\begin{bmatrix} x \\ y \\ z \end{bmatrix}$ |
||
vmatrix |
Vertical bars | $\begin{vmatrix} a & b \\ c & d \end{vmatrix}$ |
Cells separated by &, rows separated by \\.
Supported features
| Feature | Syntax | Example |
|---|---|---|
| Greek letters | $\alpha$, $\Omega$ |
α, Ω |
| Superscript | $x^{2}$ |
x² |
| Subscript | $x_{i}$ |
xᵢ |
| Fractions | $\frac{a}{b}$ |
a/b stacked |
| Square root | $\sqrt{x}$, $\sqrt[n]{x}$ |
√x, ⁿ√x |
| Accents | $\hat{x}$, $\bar{x}$, $\vec{F}$, $\tilde{x}$, $\dot{x}$ |
x̂, x̄, F⃗ |
| Font variants | $\mathrm{text}$, $\mathbf{F}$, $\mathit{x}$, $\mathcal{L}$, $\mathbb{R}$ |
roman, bold, italic, script, blackboard |
| Text mode | $\text{label}$ |
roman text inside math |
| Spacing | $a\,b$, $a\quad b$ |
thin space, em space |
| Delimiters | $\left(\frac{a}{b}\right)$ |
scaled brackets |
| Math operators | $\pm$, $\times$, $\leq$, $\infty$, $\rightarrow$ |
±, ×, ≤, ∞, → |
| Large operators | $\sum_{i}^{n}$, $\int_a^b$, $\prod$ |
Σ, ∫, Π with limits |
| Matrices | $\begin{pmatrix}...\end{pmatrix}$ |
Grid with delimiters |
Using math in annotations
Plt.Create()
    .AddSubPlot(1, 1, 1, ax => ax
        .Plot(x, y)
        .Annotate(@"$\frac{\partial f}{\partial x} = 0$ (critical point)", 5, 3.2, ann =>
        {
            ann.ArrowTargetX = 5;
            ann.ArrowTargetY = y[5];
            ann.ArrowStyle = ArrowStyle.FancyArrow;
        }))
    .Save("math_annotation.svg");