Pie & Donut Charts
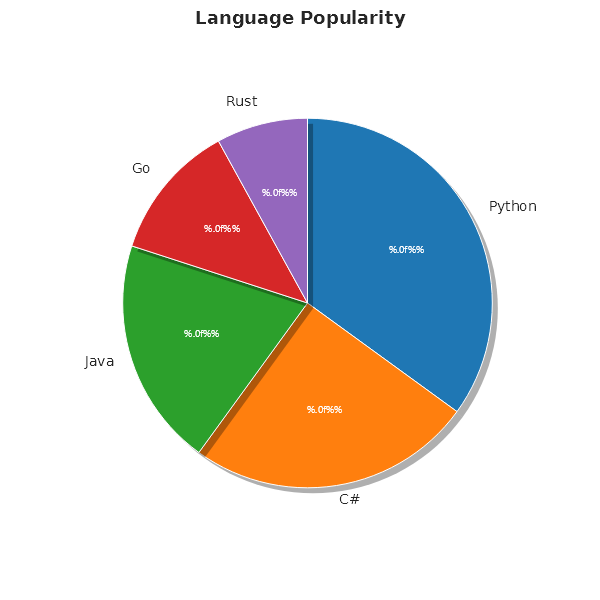
Pie chart
double[] sizes = [35, 25, 20, 12, 8];
string[] labels = ["Python", "C#", "Java", "Go", "Rust"];

Plt.Create()
    .WithTitle("Language Popularity")
    .Pie(sizes, labels)
    .Save("pie.svg");
Pie with explode, shadow, and percentage labels
Plt.Create()
    .WithTitle("Revenue Split")
    .Pie(sizes, labels, s =>
    {
        s.Explode = [0.05, 0.1, 0, 0, 0]; // pull out C#
        s.Shadow = true;
        s.AutoPct = "%.1f%%";              // "35.0%" format
        s.StartAngle = 140;
        s.CounterClockwise = true;
    })
    .Save("pie_exploded.svg");
Custom slice colors and hatches
Plt.Create()
    .Pie(sizes, labels, s =>
    {
        s.Colors = [Colors.Tab10Blue, Colors.Orange, Colors.Green, Colors.Red, Colors.Purple];
        s.Hatches = [HatchPattern.None, HatchPattern.Slash, HatchPattern.None,
                     HatchPattern.BackslashDouble, HatchPattern.None];
        s.Radius = 0.9;  // slightly smaller
    })
    .Save("pie_styled.svg");
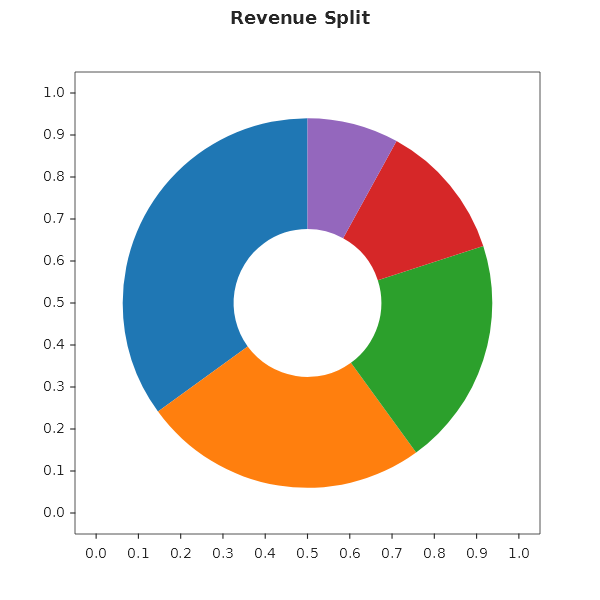
Donut chart
Plt.Create()
    .WithTitle("Revenue Split")
    .AddSubPlot(1, 1, 1, ax => ax
        .Donut(sizes, labels, s =>
        {
            s.InnerRadius = 0.4;   // 40% hole
            s.Shadow = true;
            s.AutoPct = "%.0f%%";
        }))
    .Save("donut.svg");
Nested pie (sunburst)
Inner disc shows departments, outer ring shows product breakdown:
var root = new TreeNode
{
    Label = "Revenue",
    Children = new[]
    {
        new TreeNode
        {
            Label = "Electronics", Value = 42, Color = Colors.Blue,
            Children = new[]
            {
                new TreeNode { Label = "Phones", Value = 25, Color = Colors.LightBlue },
                new TreeNode { Label = "Laptops", Value = 17, Color = Colors.SteelBlue },
            }
        },
        new TreeNode { Label = "Apparel", Value = 28, Color = Colors.Orange },
        new TreeNode { Label = "Grocery", Value = 30, Color = Colors.Green },
    }
};

Plt.Create()
    .AddSubPlot(1, 1, 1, ax => ax.NestedPie(root))
    .Save("nested_pie.svg");
Fluent API reference — PieSeries
| Property | Type | Default | Description |
|---|---|---|---|
Labels |
string[] |
none | Slice labels |
Colors |
Color[] |
auto | Per-slice colors |
Explode |
double[] |
none | Per-slice offset from center (0–1) |
StartAngle |
double |
90 |
Rotation in degrees |
CounterClockwise |
bool |
false |
Reverse slice order |
AutoPct |
string |
none | Percentage label format (e.g., "%.1f%%") |
Shadow |
bool |
false |
Drop shadow |
Radius |
double |
1.0 |
Pie radius |
Hatches |
HatchPattern[] |
none | Per-slice hatch patterns |
InnerRadius |
double |
0 |
Donut hole (0 = pie, 0.4 = donut) |
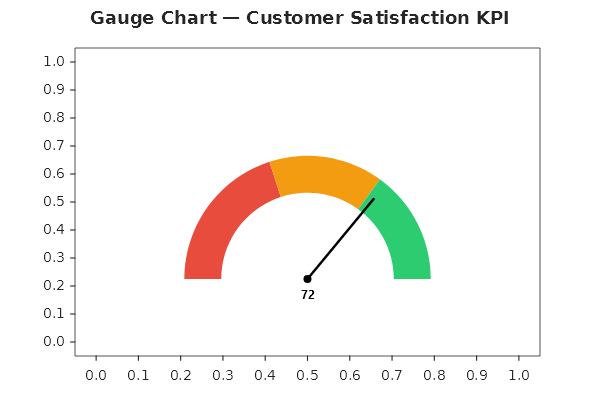
Gauge chart
Plt.Create()
    .WithTitle("Gauge — Customer Satisfaction KPI")
    .WithSize(600, 400)
    .AddSubPlot(1, 1, 1, ax => ax
        .Gauge(72, s =>
        {
            s.Min = 0;
            s.Max = 100;
            s.NeedleColor = Colors.Black;
            s.Ranges =
            [
                new GaugeBand(40,  Color.FromHex("#E74C3C")),
                new GaugeBand(70,  Color.FromHex("#F39C12")),
                new GaugeBand(100, Color.FromHex("#2ECC71")),
            ];
        }))
    .Save("gauge_chart.svg");
Ranges defines color bands: each GaugeBand(Threshold, Color) entry covers from the previous threshold (or Min) up to Threshold.
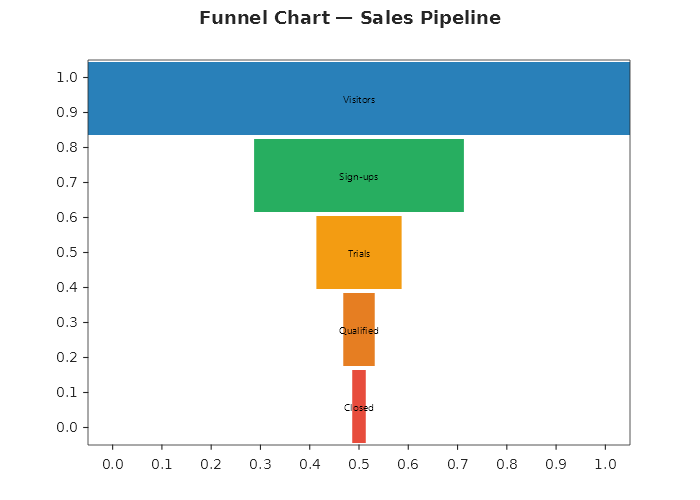
Funnel chart
string[] stages = ["Visitors", "Sign-ups", "Trials", "Qualified", "Closed"];
double[] counts = [12_400, 4_800, 1_950, 720, 310];

Plt.Create()
    .WithTitle("Funnel Chart — Sales Pipeline")
    .WithSize(700, 500)
    .AddSubPlot(1, 1, 1, ax => ax
        .Funnel(stages, counts, s =>
        {
            s.Colors = [
                Color.FromHex("#2980B9"),
                Color.FromHex("#27AE60"),
                Color.FromHex("#F39C12"),
                Color.FromHex("#E67E22"),
                Color.FromHex("#E74C3C"),
            ];
        }))
    .Save("funnel_chart.svg");