Polar Charts
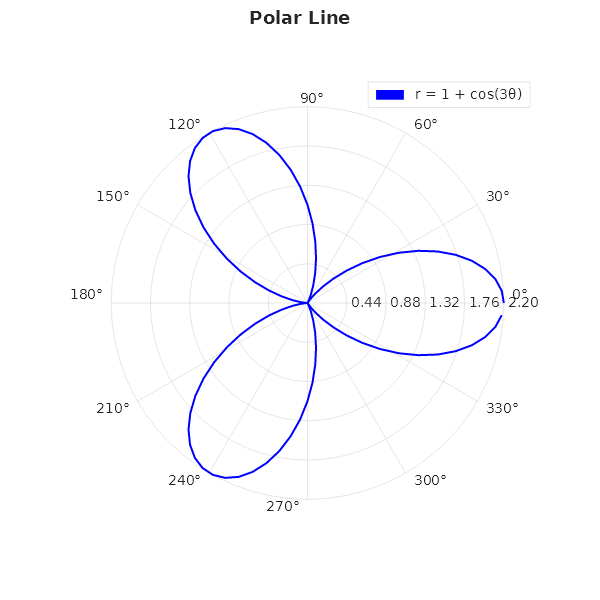
Polar line
double[] theta = Enumerable.Range(0, 100)
    .Select(i => i * 2 * Math.PI / 100).ToArray();
double[] r = theta.Select(t => 1 + Math.Cos(3 * t)).ToArray();

Plt.Create()
    .AddSubPlot(1, 1, 1, ax => ax
        .SetPolar()
        .PolarPlot(theta, r, s =>
        {
            s.Color = Colors.Blue;
            s.LineWidth = 2.0;
            s.LineStyle = LineStyle.Solid;
            s.Label = "r = 1 + cos(3θ)";
        })
        .WithLegend())
    .Save("polar_line.svg");
Multi-series polar
Plt.Create()
    .AddSubPlot(1, 1, 1, ax => ax
        .SetPolar()
        .PolarPlot(theta, r1, s => { s.Color = Colors.Blue; s.Label = "cos(3θ)"; })
        .PolarPlot(theta, r2, s => { s.Color = Colors.Red; s.LineStyle = LineStyle.Dashed; s.Label = "sin(2θ)"; })
        .WithLegend(LegendPosition.UpperRight))
    .Save("polar_multi.svg");
Radar chart
string[] categories = ["Speed", "Power", "Defense", "Range", "Accuracy"];
double[] values = [85, 70, 90, 60, 95];

Plt.Create()
    .AddSubPlot(1, 1, 1, ax => ax
        .Radar(categories, values, s =>
        {
            s.Color = Colors.Blue;
            s.Alpha = 0.3;   // fill transparency
        }))
    .Save("radar.svg");
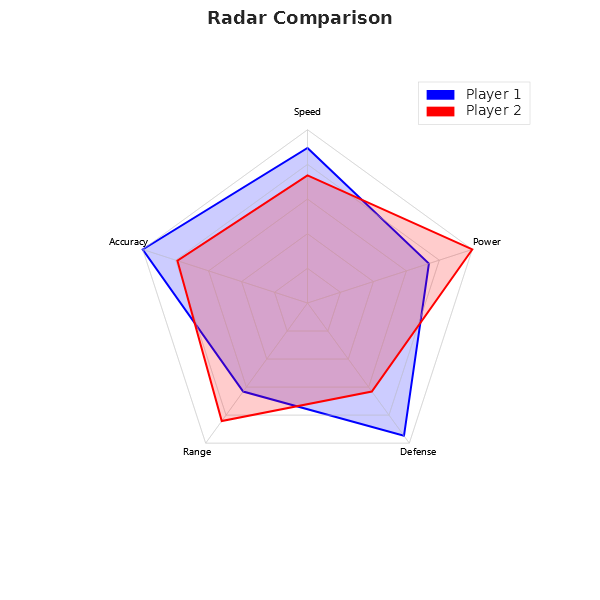
Radar comparison (two players)
double[] player1 = [85, 70, 90, 60, 95];
double[] player2 = [70, 95, 60, 80, 75];

Plt.Create()
    .AddSubPlot(1, 1, 1, ax => ax
        .Radar(categories, player1, s => { s.Color = Colors.Blue; s.Alpha = 0.2; s.Label = "Player 1"; })
        .Radar(categories, player2, s => { s.Color = Colors.Red;  s.Alpha = 0.2; s.Label = "Player 2"; })
        .WithLegend())
    .Save("radar_comparison.svg");
Polar bar
double[] barTheta = Enumerable.Range(0, 8).Select(i => i * Math.PI / 4).ToArray();
double[] barR = [3, 5, 7, 4, 6, 8, 2, 5];

Plt.Create()
    .AddSubPlot(1, 1, 1, ax => ax
        .SetPolar()
        .PolarBar(barTheta, barR, s =>
        {
            s.Color = Colors.Teal;
            s.Alpha = 0.7;
            s.EdgeColor = Colors.DarkCyan;
        }))
    .Save("polar_bar.svg");
Polar scatter
Plt.Create()
    .AddSubPlot(1, 1, 1, ax => ax
        .SetPolar()
        .PolarScatter(theta, r, s =>
        {
            s.Color = Colors.Purple;
            s.MarkerSize = 4;
            s.Alpha = 0.6;
            s.Label = "Measurements";
        })
        .WithLegend())
    .Save("polar_scatter.svg");
Polar heatmap
var data = new double[12, 8]; // 12 angular bins × 8 radial bins
for (int t = 0; t < 12; t++)
    for (int r = 0; r < 8; r++)
        data[t, r] = Math.Sin(t * 0.5) * Math.Cos(r * 0.4);

Plt.Create()
    .AddSubPlot(1, 1, 1, ax => ax
        .SetPolar()
        .PolarHeatmap(data, thetaBins: 12, rBins: 8)
        .WithColorMap("viridis")
        .WithColorBar())
    .Save("polar_heatmap.svg");
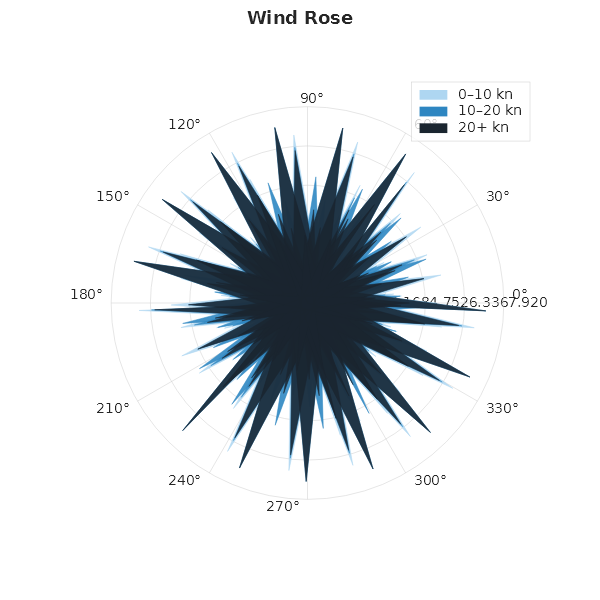
Wind rose
Three PolarBarSeries represent different wind speed bins; each uses the same 8 compass directions.
double[] directions = [0, 45, 90, 135, 180, 225, 270, 315];
double[] freqSlow  = [5.2, 4.1, 6.8, 3.5, 4.9, 7.2, 5.5, 3.8]; // 0–10 kn
double[] freqMed   = [3.1, 2.8, 4.2, 2.1, 3.4, 4.8, 3.2, 2.5]; // 10–20 kn
double[] freqFast  = [1.2, 0.9, 1.8, 0.7, 1.1, 2.1, 1.4, 0.8]; // 20+ kn

Plt.Create()
    .WithTitle("Wind Rose")
    .WithSize(600, 600)
    .AddSubPlot(1, 1, 1, ax => ax
        .PolarBar(freqSlow, directions, s => { s.Color = Color.FromHex("#AED6F1"); s.Alpha = 0.85; s.Label = "0–10 kn"; s.BarWidth = 40; })
        .PolarBar(freqMed,  directions, s => { s.Color = Color.FromHex("#2E86C1"); s.Alpha = 0.85; s.Label = "10–20 kn"; s.BarWidth = 40; })
        .PolarBar(freqFast, directions, s => { s.Color = Color.FromHex("#1A252F"); s.Alpha = 0.85; s.Label = "20+ kn"; s.BarWidth = 40; })
        .WithLegend())
    .Save("wind_rose.svg");