Sankey Diagrams
.WithSankeyHover() enables ECharts-style focus: adjacency: hovering a node
dims every link that isn't reachable upstream or downstream from it, so the
selected flow chain stands out. Keyboard-accessible via Tab focus (each node
has tabindex="0"). Dim opacities are themable via
WithInteractionTheme(new InteractionTheme(SankeyDimLinkOpacity: 0.04, SankeyDimNodeOpacity: 0.2)).
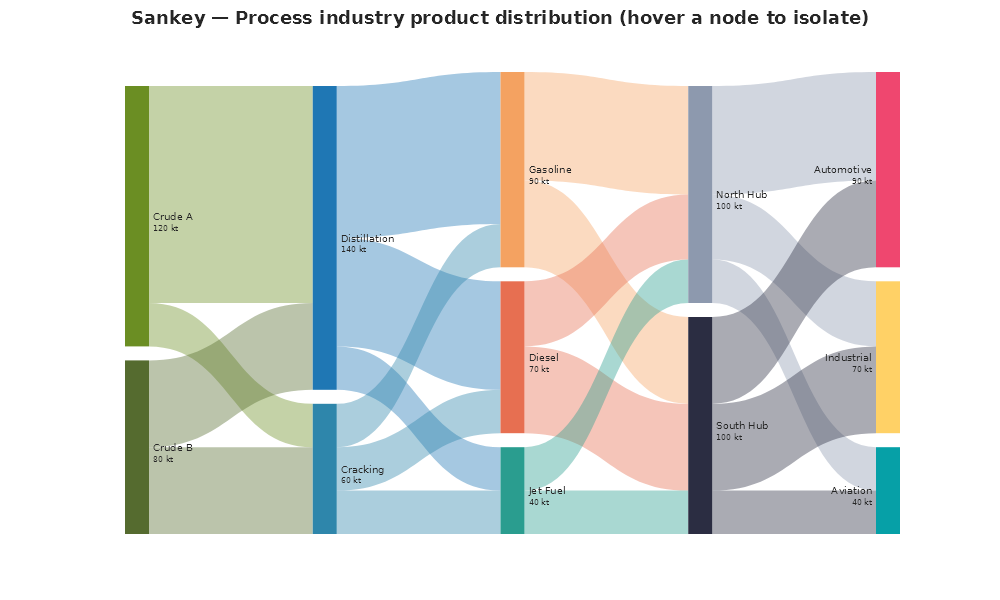
Process industry distribution (5-column cascade)
Plt.Create()
    .WithTitle("Sankey — Process industry product distribution")
    .WithSize(1000, 600)
    .WithSankeyHover()
    .AddSubPlot(1, 1, 1, ax => ax
        .HideAllAxes()
        .Sankey(nodes, links, s =>
        {
            s.NodeWidth = 24;
            s.NodePadding = 14;
            s.Iterations = 20;
            s.LinkColorMode = SankeyLinkColorMode.Gradient;
        }))
    .Save("sankey.svg");
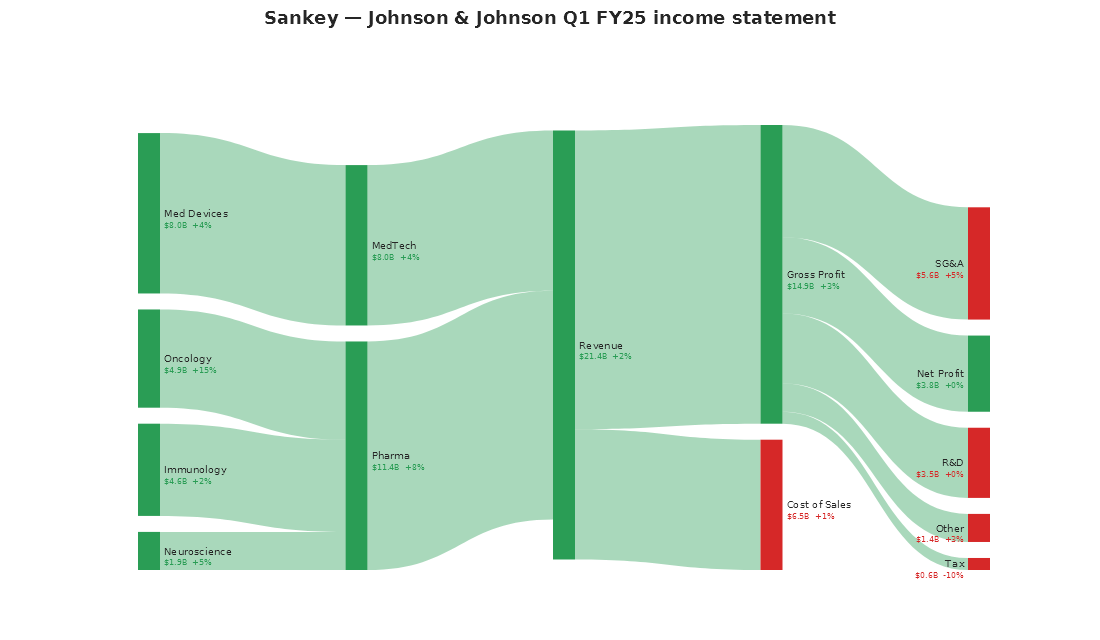
Income statement (J&J-style flow)
Sub-labels carry Y/Y change indicators coloured green (profit) or red (cost):
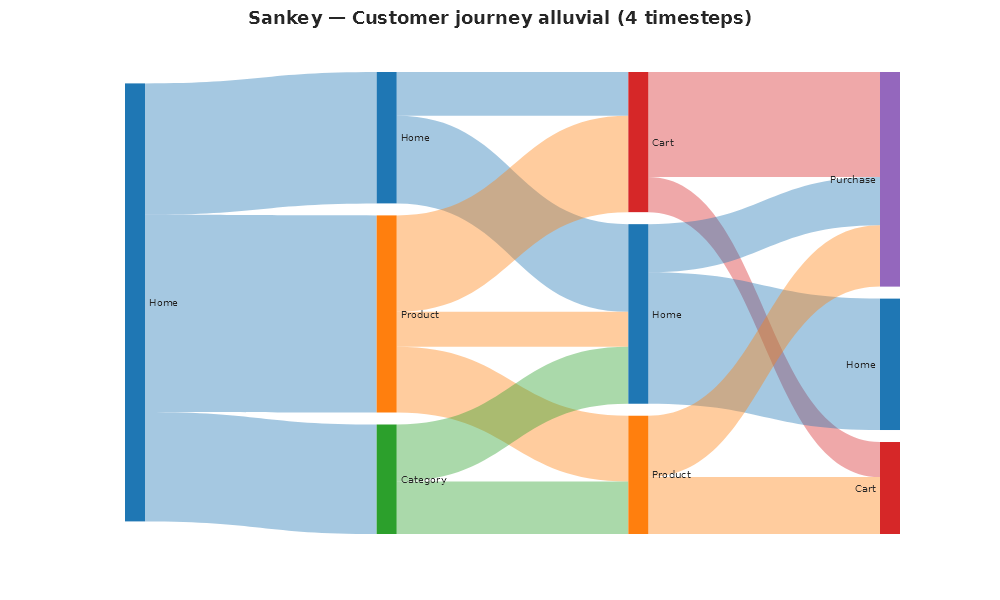
Customer journey alluvial (4 timesteps)
Explicit column pinning places the same page labels across time-steps:
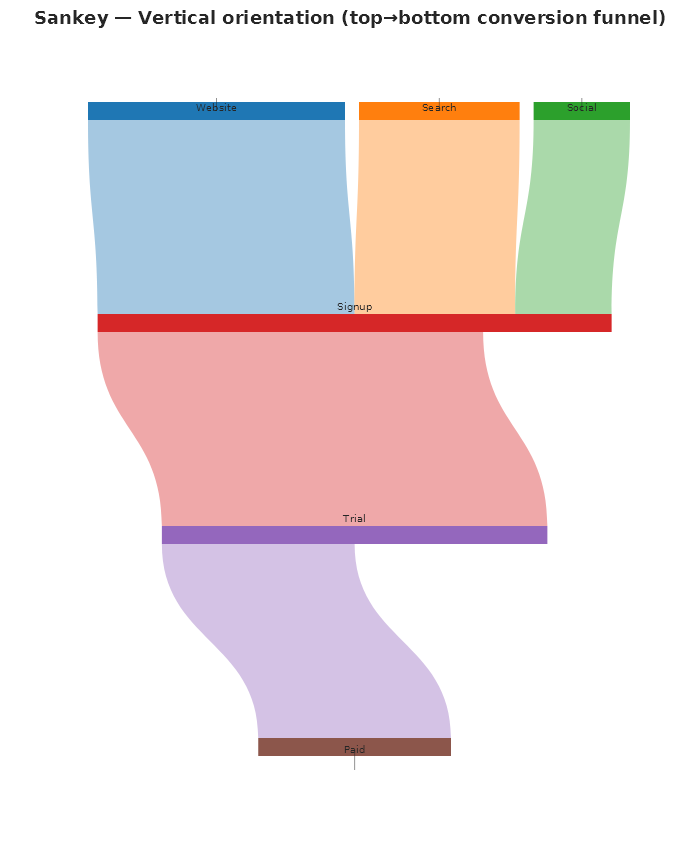
Vertical orientation (top-to-bottom)
Plt.Create()
    .AddSubPlot(1, 1, 1, ax => ax
        .HideAllAxes()
        .Sankey(nodes, links, s =>
        {
            s.Orient = SankeyOrientation.Vertical;
            s.LinkColorMode = SankeyLinkColorMode.Gradient;
        }))
    .Save("sankey_vertical.svg");
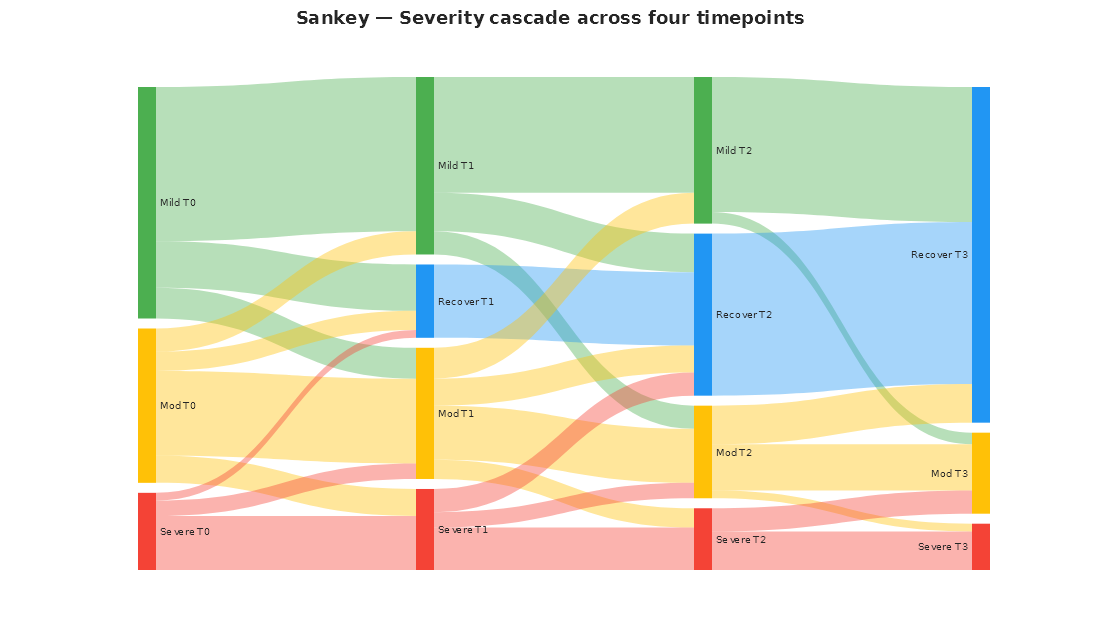
Severity cascade (4 timepoints)
Dense many-to-many transitions where relaxation iterations minimize crossings: