Subplots & GridSpec
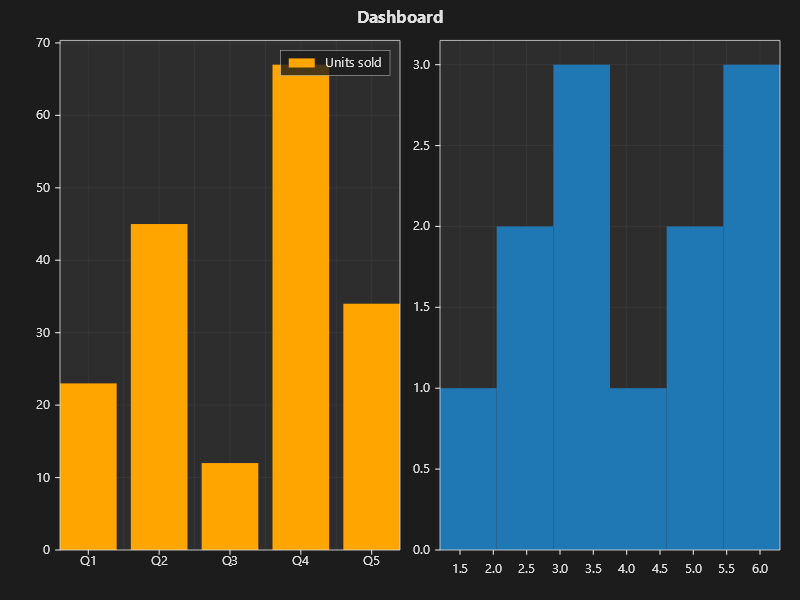
Multi-subplot dashboard
string[] categories = ["Q1", "Q2", "Q3", "Q4", "Q5"];
double[] values = [23, 45, 12, 67, 34];
double[] histData = [1.2, 2.3, 2.1, 3.4, 3.5, 3.6, 4.1, 4.8, 5.2, 5.5, 6.1, 6.3];

Plt.Create()
    .WithTitle("Dashboard")
    .WithTheme(Theme.Dark)
    .Bar(categories, values, bar => { bar.Color = Colors.Orange; bar.Label = "Units sold"; })
    .AddSubPlot(1, 2, 2, ax => ax.Hist(histData, 6))
    .Save("dashboard.svg");
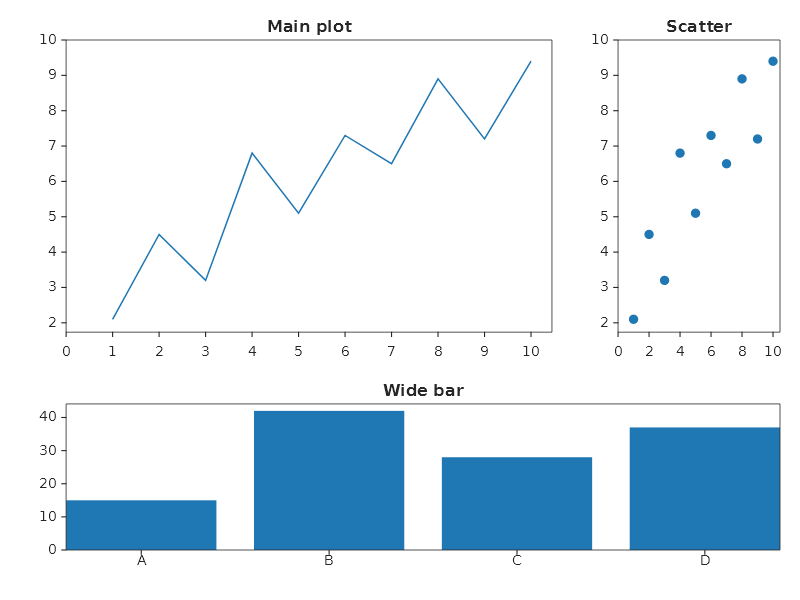
GridSpec with ratio control
Use WithGridSpec to control row and column proportions:
Plt.Create()
    .WithGridSpec(2, 2, heightRatios: [2.0, 1.0], widthRatios: [3.0, 1.0])
    .AddSubPlot(GridPosition.Single(0, 0), ax => ax.Plot(x, y).WithTitle("Main plot"))
    .AddSubPlot(GridPosition.Single(0, 1), ax => ax.Scatter(x, y).WithTitle("Scatter"))
    .AddSubPlot(new GridPosition(1, 2, 0, 2), ax => ax.Bar(categories, catValues).WithTitle("Wide bar"))
    .TightLayout()
    .Save("gridspec_layout.svg");
Mosaic layout (string-based)
Define subplot layout with a string pattern — each letter is a panel:
Plt.Mosaic("AAB\nCCB")
    .Panel('A', ax => ax.Plot(x, y).WithTitle("Main chart"))
    .Panel('B', ax => ax.Hist(data, 20).WithTitle("Distribution"))
    .Panel('C', ax => ax.Bar(categories, values).WithTitle("Categories"))
    .TightLayout()
    .Save("mosaic.svg");
Spanning subplot
A single subplot can span multiple grid cells:
Plt.Create()
    .WithGridSpec(2, 3)
    // Top row: one wide chart spanning 3 columns
    .AddSubPlot(new GridPosition(0, 1, 0, 3), ax => ax
        .Plot(x, y, s => s.Label = "Full width")
        .WithTitle("Top — spans 3 columns")
        .WithLegend())
    // Bottom row: 3 individual charts
    .AddSubPlot(GridPosition.Single(1, 0), ax => ax.Bar(["A", "B"], [10, 20]))
    .AddSubPlot(GridPosition.Single(1, 1), ax => ax.Pie([60, 40], ["Yes", "No"]))
    .AddSubPlot(GridPosition.Single(1, 2), ax => ax.Scatter(x, y))
    .TightLayout()
    .Save("spanning.svg");
Subplot spacing
Plt.Create()
    .WithSubPlotSpacing(s => s with
    {
        Left = 0.1,
        Right = 0.95,
        Top = 0.9,
        Bottom = 0.1,
        WSpace = 0.3,   // horizontal gap between subplots
        HSpace = 0.4,   // vertical gap between subplots
    })
    .AddSubPlot(2, 2, 1, ax => ax.Plot(x, y1).WithTitle("A"))
    .AddSubPlot(2, 2, 2, ax => ax.Plot(x, y2).WithTitle("B"))
    .AddSubPlot(2, 2, 3, ax => ax.Plot(x, y3).WithTitle("C"))
    .AddSubPlot(2, 2, 4, ax => ax.Plot(x, y4).WithTitle("D"))
    .Save("spacing.svg");
Inset axes
Nested axes within a parent subplot:
Plt.Create()
    .AddSubPlot(1, 1, 1, ax => ax
        .Plot(x, y, s => s.Label = "Full data")
        .AddInset(0.55, 0.55, 0.4, 0.4, inset => inset
            .Plot(xDetail, yDetail, s => s.Color = Colors.Red)
            .WithTitle("Detail"))
        .WithLegend())
    .Save("inset.svg");
Shared axes
Subplots with linked axis ranges:
Plt.Create()
    .AddSubPlot(2, 1, 1, ax => ax
        .Plot(x, y1).WithTitle("Sensor A").ShareX("group1"))
    .AddSubPlot(2, 1, 2, ax => ax
        .Plot(x, y2).WithTitle("Sensor B").ShareX("group1"))
    .TightLayout()
    .Save("shared_axes.svg");
Tight layout vs constrained layout
// TightLayout: simple margin adjustment
Plt.Create()
    .AddSubPlot(2, 2, 1, ax => ax.Plot(x, y))
    .AddSubPlot(2, 2, 2, ax => ax.Plot(x, y))
    .TightLayout()
    .Save("tight.svg");

// ConstrainedLayout: advanced, handles tick labels + colorbars
Plt.Create()
    .AddSubPlot(2, 2, 1, ax => ax.Heatmap(matrix).WithColorBar())
    .AddSubPlot(2, 2, 2, ax => ax.Plot(x, y))
    .ConstrainedLayout()
    .Save("constrained.svg");
Fluent API reference
| Method | Description |
|---|---|
.AddSubPlot(rows, cols, index, cfg) |
Grid-based subplot |
.AddSubPlot(GridPosition, cfg) |
GridSpec-based subplot (span rows/cols) |
.WithGridSpec(rows, cols, heightRatios?, widthRatios?) |
Row/column size ratios |
Plt.Mosaic(pattern) |
String-based layout (returns MosaicFigureBuilder) |
.Panel(char, cfg) |
Configure mosaic panel by letter |
.AddInset(x, y, w, h, cfg) |
Nested axes (fractional coordinates) |
.ShareX(key) / .ShareY(key) |
Link axis ranges between subplots |
.TightLayout() |
Auto-adjust margins |
.ConstrainedLayout() |
Advanced margin adjustment |
.WithSubPlotSpacing(cfg) |
Manual margin/gap control |
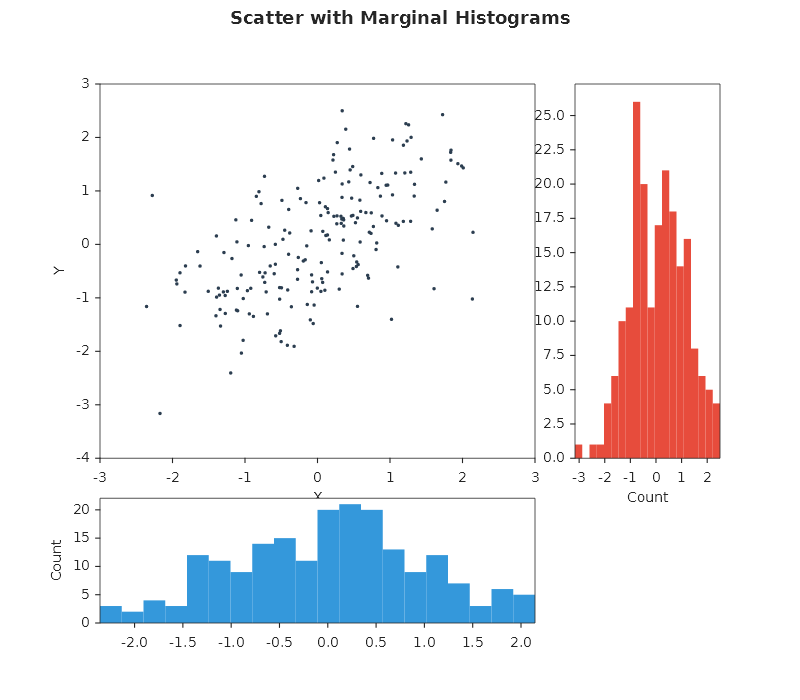
Scatter with marginal histograms
Use WithGridSpec + GridPosition to lay out the scatter (large cell) and two marginal histograms.
var rng = new Random(17);
double BM(Random r) { double u1 = 1 - r.NextDouble(), u2 = 1 - r.NextDouble(); return Math.Sqrt(-2 * Math.Log(u1)) * Math.Sin(2 * Math.PI * u2); }
double[] xs = Enumerable.Range(0, 200).Select(_ => BM(rng)).ToArray();
double[] ys = xs.Select(x => 0.6 * x + BM(rng) * 0.8).ToArray();

Plt.Create()
    .WithTitle("Scatter with Marginals")
    .WithSize(800, 700)
    .WithGridSpec(2, 2, heightRatios: [3.0, 1.0], widthRatios: [3.0, 1.0])
    .AddSubPlot(new GridPosition(0, 1, 0, 1), ax => ax
        .Scatter(xs, ys, s => { s.Color = Color.FromHex("#2C3E50"); s.Alpha = 0.5; s.MarkerSize = 5; })
        .SetXLabel("X").SetYLabel("Y"))
    .AddSubPlot(new GridPosition(0, 1, 1, 2), ax => ax
        .Hist(ys, bins: 20, s => { s.Color = Color.FromHex("#E74C3C"); })
        .SetXLabel("Count"))
    .AddSubPlot(new GridPosition(1, 2, 0, 1), ax => ax
        .Hist(xs, bins: 20, s => { s.Color = Color.FromHex("#3498DB"); })
        .SetYLabel("Count"))
    .Save("scatter_marginals.svg");
GridPosition(rowStart, rowEnd, colStart, colEnd) uses zero-based exclusive indices.