Symlog Axis
Symmetric logarithmic scale — linear near zero, logarithmic for large values. Perfect for data spanning both positive and negative ranges across orders of magnitude.
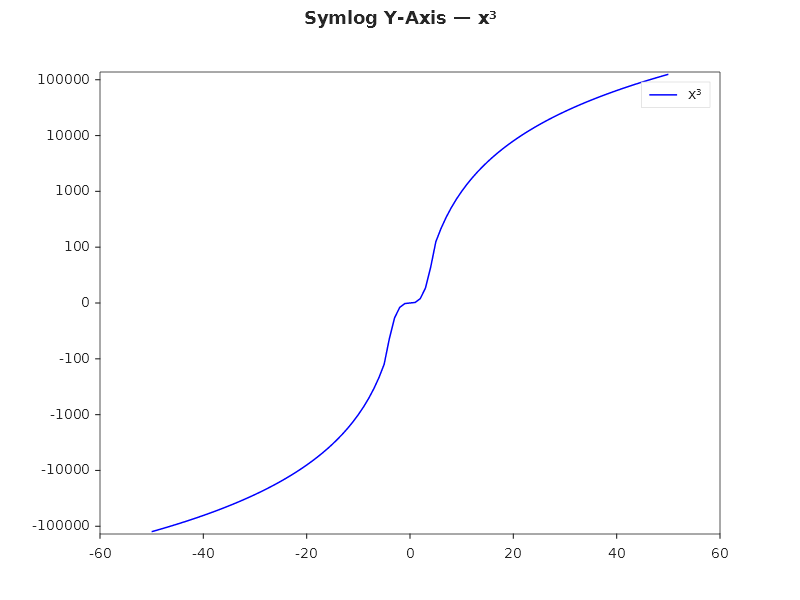
Basic symlog Y-axis
double[] x = Enumerable.Range(-50, 101).Select(i => (double)i).ToArray();
double[] y = x.Select(v => v * v * v).ToArray(); // cubic: ranges from -125000 to +125000

Plt.Create()
    .AddSubPlot(1, 1, 1, ax => ax
        .Plot(x, y, s => s.Label = "x³")
        .WithSymlogYScale(linthresh: 100)  // linear within [-100, 100]
        .WithLegend())
    .Save("symlog.svg");
Financial P&L
// Profit/loss data spanning -$50K to +$200K
double[] months = Enumerable.Range(1, 12).Select(i => (double)i).ToArray();
double[] pnl = [-5000, -2000, 500, 3000, -800, 15000, 45000, -3000, 80000, 120000, -10000, 200000];

Plt.Create()
    .WithTitle("Monthly P&L")
    .AddSubPlot(1, 1, 1, ax => ax
        .Bar(months.Select(m => $"M{m}").ToArray(), pnl)
        .WithSymlogYScale(linthresh: 1000)
        .SetYLabel("Profit/Loss ($)"))
    .Save("pnl_symlog.svg");
Symlog on X-axis
// Data with both small and large X values
double[] xData = [-10000, -1000, -100, -10, -1, 0, 1, 10, 100, 1000, 10000];
double[] yData = xData.Select(v => Math.Sin(v * 0.001) * 100).ToArray();

Plt.Create()
    .AddSubPlot(1, 1, 1, ax => ax
        .Scatter(xData, yData, s =>
        {
            s.Color = Colors.Purple;
            s.MarkerSize = 8;
            s.Label = "Measurements";
        })
        .WithSymlogXScale(linthresh: 10)
        .SetXLabel("Frequency (Hz)")
        .SetYLabel("Response (dB)")
        .WithLegend())
    .Save("symlog_x.svg");
Symlog vs Log vs Linear comparison
Plt.Create()
    .WithSize(1200, 400)
    .AddSubPlot(1, 3, 1, ax => ax
        .Plot(x, y).WithTitle("Linear"))
    .AddSubPlot(1, 3, 2, ax => ax
        .Plot(x.Where(v => v > 0).ToArray(), y.Where((v, i) => x[i] > 0).ToArray())
        .SetYScale(AxisScale.Log)
        .WithTitle("Log (positive only)"))
    .AddSubPlot(1, 3, 3, ax => ax
        .Plot(x, y)
        .WithSymlogYScale(linthresh: 100)
        .WithTitle("Symlog (handles negative)"))
    .TightLayout()
    .Save("scale_comparison.svg");
How symlog works
 |x| <= linthresh  →  linear (identity)
 |x| >  linthresh  →  sign(x) × linthresh × (1 + log₁₀(|x|/linthresh))
The linthresh parameter controls where the transition from linear to logarithmic occurs. Smaller values = more of the axis is logarithmic.
Fluent API reference
| Method | Parameters | Description |
|---|---|---|
.WithSymlogYScale(linthresh) |
double (default 1.0) |
Symmetric log on Y-axis |
.WithSymlogXScale(linthresh) |
double (default 1.0) |
Symmetric log on X-axis |
.SetYScale(AxisScale.SymLog) |
AxisScale |
Alternative via enum |
.SetXScale(AxisScale.SymLog) |
AxisScale |
Alternative via enum |
| AxisScale | Description |
|---|---|
Linear |
Standard linear scale |
Log |
Logarithmic base 10 (positive data only) |
SymLog |
Symmetric log (handles positive + negative) |
Logit |
Probability scale for (0, 1) data |
Date |
OLE Automation date values |