3D Charts
MatPlotLibNet includes a full 3D projection pipeline: Projection3D (World → View → NDC → Pixel), DepthQueue3D painter's algorithm, Vec3.FaceNormal face-normal shading via Color.Shade / Color.Modulate extensions, and Svg3DRotationScript for client-side rotation in SVG.
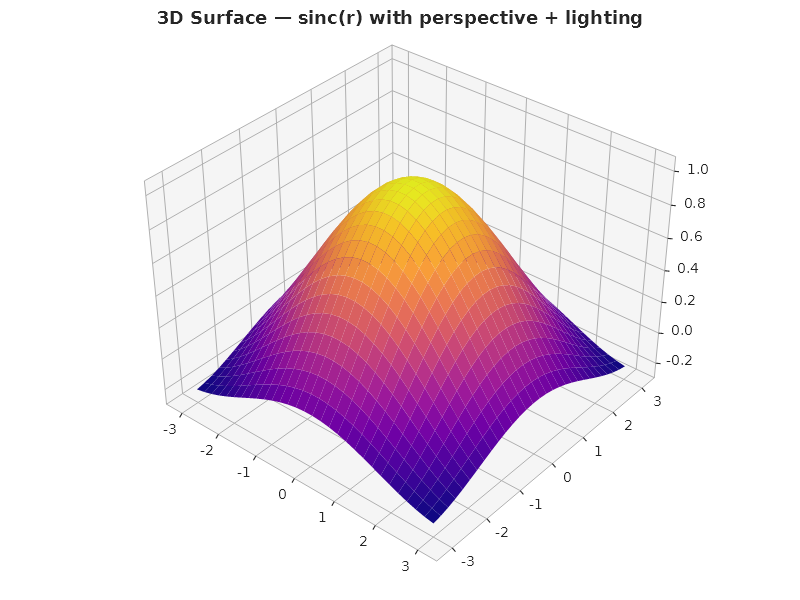
Surface plot
Plt.Create()
    .WithTitle("3D Surface — sinc(r)")
    .WithSize(800, 600)
    .AddSubPlot(1, 1, 1, ax => ax
        .WithCamera(elevation: 35, azimuth: -50, distance: 6.0)
        .WithLighting(dx: 0.5, dy: -0.5, dz: 1.0, ambient: 0.3, diffuse: 0.7)
        .Surface(x, y, z, s =>
        {
            s.ColorMap = ColorMaps.Plasma;
            s.ShowWireframe = false;
            s.Alpha = 1.0;
        }))
    .Save("surface.svg");
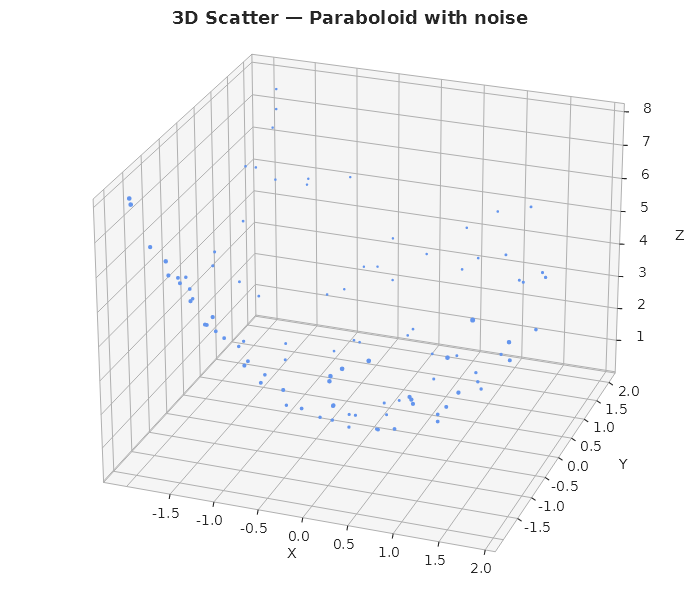
3D Scatter
Plt.Create()
    .WithTitle("3D Scatter — Paraboloid")
    .AddSubPlot(1, 1, 1, ax => ax
        .WithCamera(elevation: 25, azimuth: -70)
        .Scatter3D(x, y, z, s => { s.Color = Colors.CornflowerBlue; s.MarkerSize = 5; }))
    .Save("scatter3d.svg");
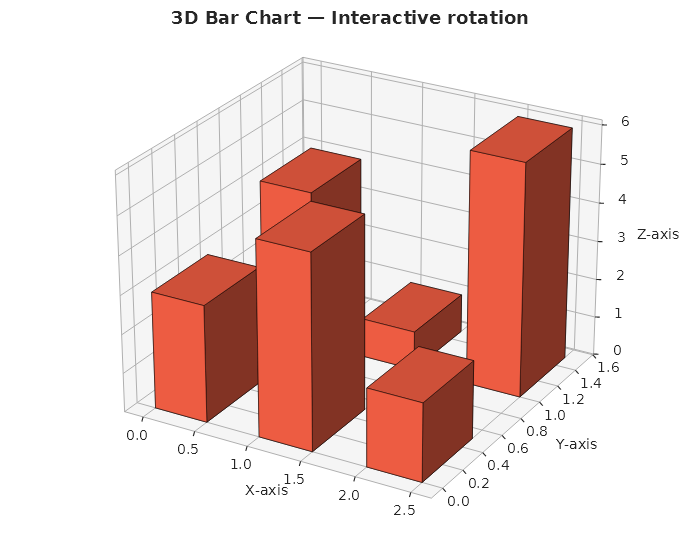
3D Bar chart with interactive rotation
Plt.Create()
    .WithTitle("3D Bar Chart")
    .With3DRotation()
    .AddSubPlot(1, 1, 1, ax => ax
        .WithCamera(elevation: 25, azimuth: -60)
        .WithLighting(dx: -0.4, dy: -0.8, dz: 0.45)
        .Bar3D(x, y, z, s => { s.Color = Colors.Tomato; s.BarWidth = 0.5; }))
    .Save("bar3d.svg");
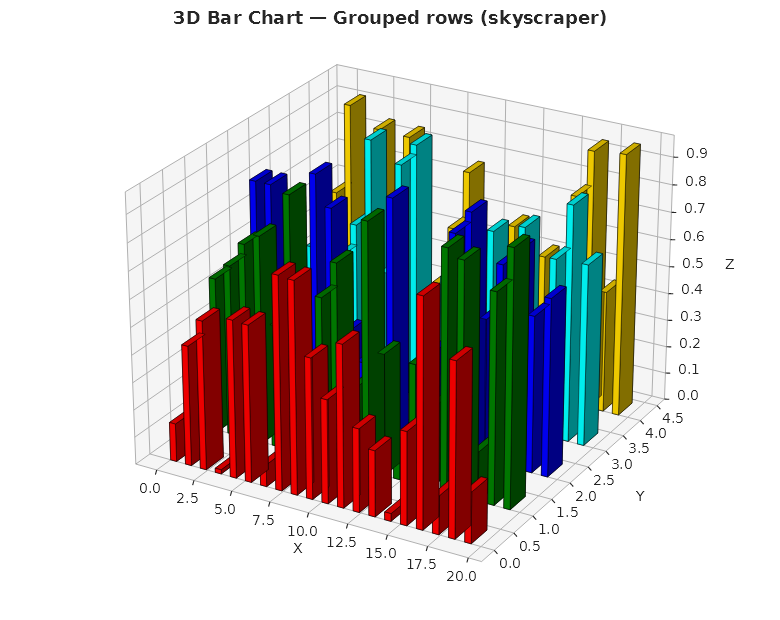
Grouped 3D bars
Multiple Bar3D series share depth sorting automatically:
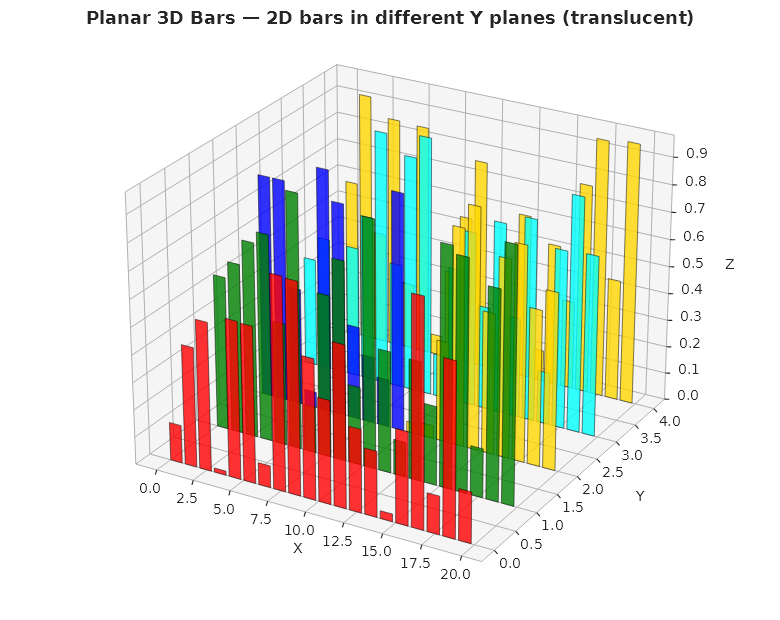
Planar 3D bars
Flat translucent rectangles on discrete Y planes:
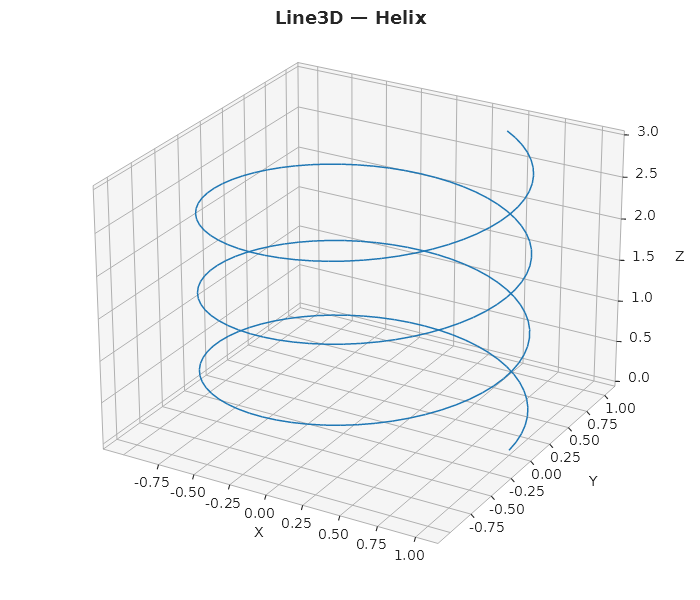
Line3D — helix polyline (v1.3.0)
double[] t = Enumerable.Range(0, 200).Select(i => i * 0.1).ToArray();

Plt.Create()
    .WithTitle("Line3D — Helix")
    .With3DRotation()
    .AddSubPlot(1, 1, 1, ax => ax
        .Plot3D(t.Select(v => Math.Cos(v)).ToArray(),
                t.Select(v => Math.Sin(v)).ToArray(),
                t.Select(v => v * 0.15).ToArray(),
                s => { s.Color = Colors.Tab10Blue; s.LineWidth = 1.5; })
        .WithCamera(elevation: 25, azimuth: -60))
    .Save("line3d.svg");
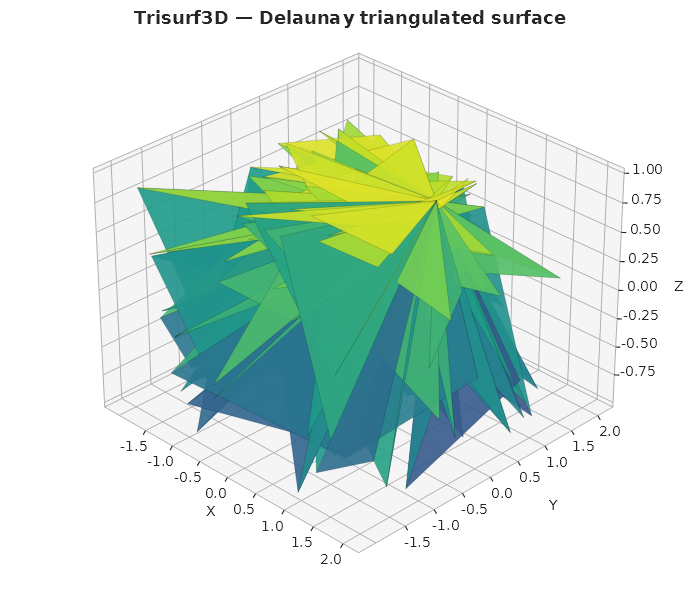
Trisurf3D — Delaunay triangulated surface (v1.3.0)
Plt.Create()
    .WithTitle("Trisurf3D")
    .With3DRotation()
    .AddSubPlot(1, 1, 1, ax => ax
        .Trisurf(x, y, z, s =>
        {
            s.ColorMap = ColorMaps.Viridis;
            s.Alpha = 0.9;
            s.ShowWireframe = true;
        })
        .WithCamera(elevation: 30, azimuth: -45))
    .Save("trisurf.svg");
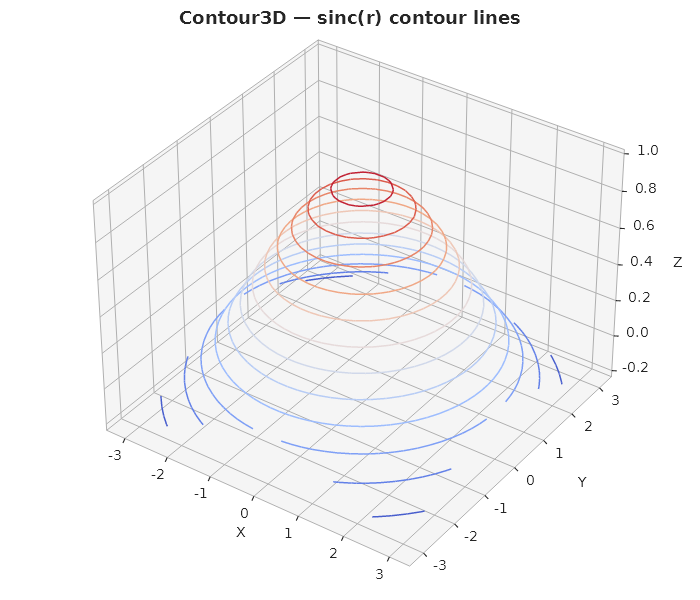
Contour3D — contour lines in 3D (v1.3.0)
Plt.Create()
    .WithTitle("Contour3D — sinc(r)")
    .With3DRotation()
    .AddSubPlot(1, 1, 1, ax => ax
        .Contour3D(x, y, z, s =>
        {
            s.Levels = 12;
            s.ColorMap = ColorMaps.Coolwarm;
            s.LineWidth = 1.5;
        })
        .WithCamera(elevation: 35, azimuth: -55))
    .Save("contour3d.svg");
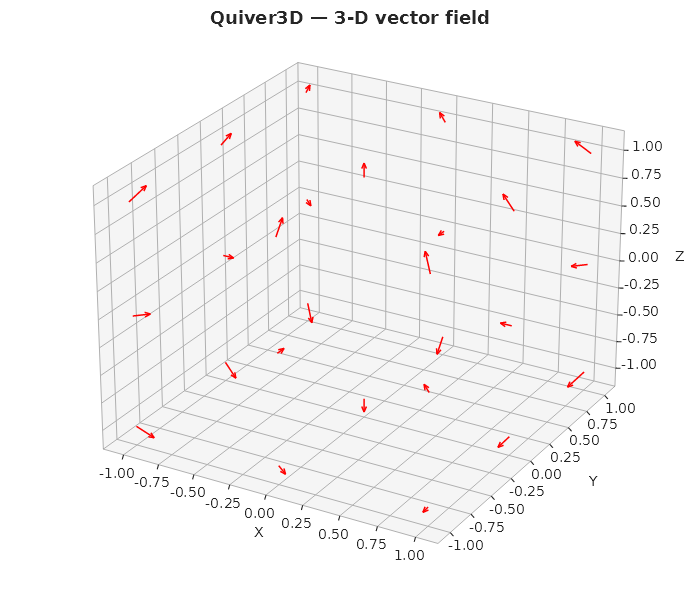
Quiver3D — 3D vector field (v1.3.0)
Plt.Create()
    .WithTitle("Quiver3D — 3-D vector field")
    .With3DRotation()
    .AddSubPlot(1, 1, 1, ax => ax
        .Quiver3D(x, y, z, u, v, w,
            s => { s.Color = Colors.Red; s.ArrowLength = 0.25; })
        .WithCamera(elevation: 25, azimuth: -60))
    .Save("quiver3d.svg");
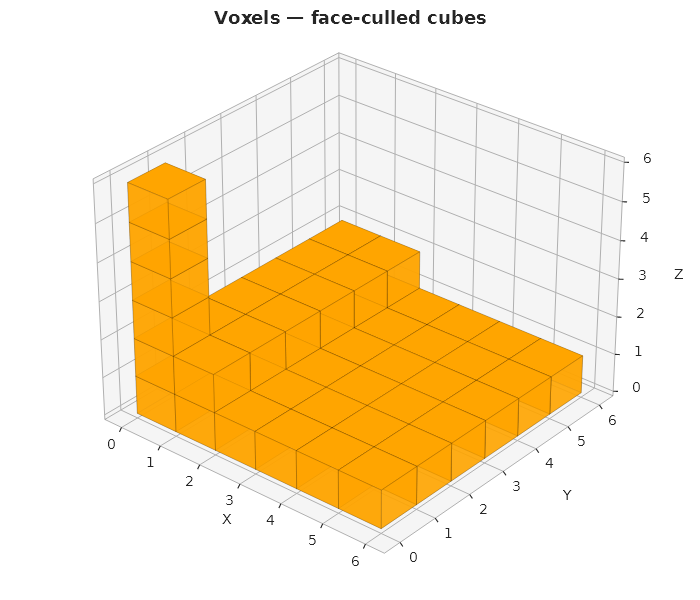
Voxels — volumetric cubes (v1.3.0)
var filled = new bool[6, 6, 6];
// Create an L-shaped structure with a pillar
// ...

Plt.Create()
    .WithTitle("Voxels — face-culled cubes")
    .With3DRotation()
    .AddSubPlot(1, 1, 1, ax => ax
        .Voxels(filled, s => { s.Color = Colors.Orange; s.Alpha = 0.85; })
        .WithCamera(elevation: 30, azimuth: -50))
    .Save("voxels.svg");
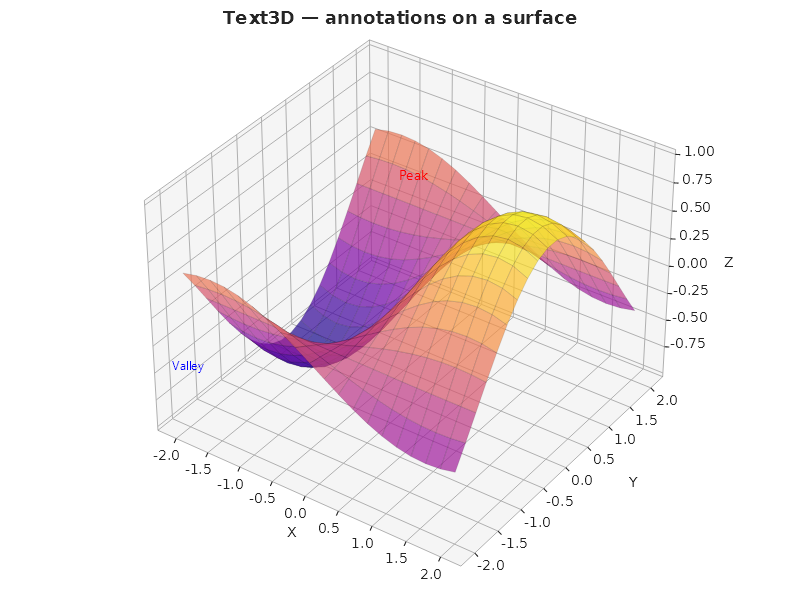
Text3D — 3D annotations (v1.3.0)
Plt.Create()
    .WithTitle("Text3D — annotations on a surface")
    .With3DRotation()
    .AddSubPlot(1, 1, 1, ax => ax
        .Surface(x, y, z, s => { s.ColorMap = ColorMaps.Plasma; s.Alpha = 0.7; })
        .Text3D(0, 0, 1.0, "Peak", s => { s.Color = Colors.Red; s.FontSize = 14; })
        .Text3D(-2, -2, -0.5, "Valley", s => { s.Color = Colors.Blue; s.FontSize = 12; })
        .WithCamera(elevation: 35, azimuth: -55))
    .Save("text3d.svg");