Tick Formatting
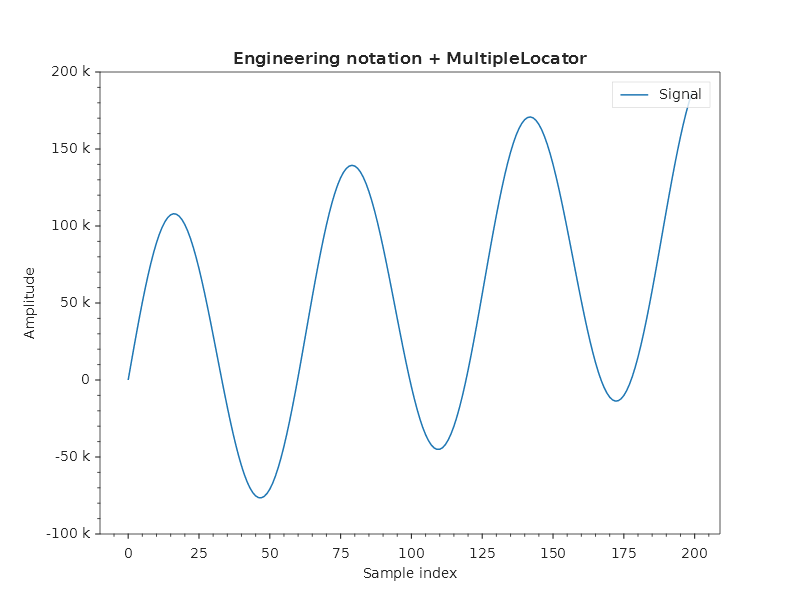
Engineering notation
EngFormatter displays values as 100k, 50M, 2.5G:
Plt.Create()
    .AddSubPlot(1, 1, 1, ax => ax
        .WithTitle("Engineering notation + MultipleLocator")
        .SetXLabel("Sample index")
        .SetYLabel("Amplitude")
        .Plot(x, y, line => { line.Label = "Signal"; })
        .SetYTickFormatter(new EngFormatter())
        .SetXTickLocator(new MultipleLocator(25))
        .WithMinorTicks())
    .Save("tick_locators.svg");
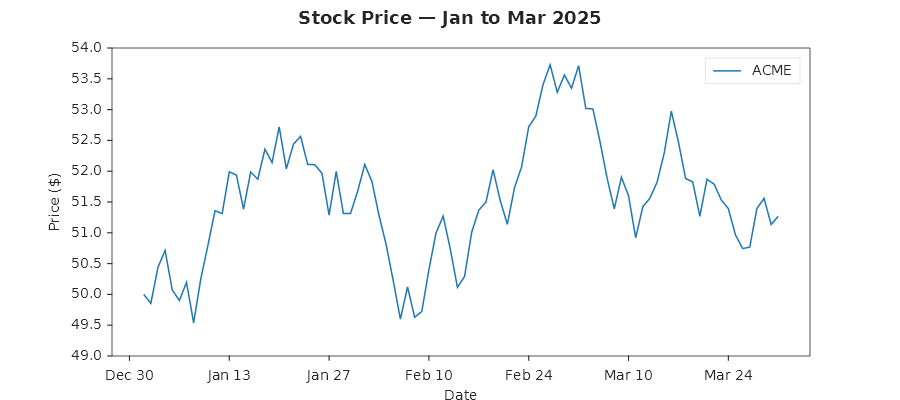
Date axes
DateTime[] arrays are handled automatically with AutoDateLocator:
DateTime[] dates = Enumerable.Range(0, 90)
    .Select(i => new DateTime(2025, 1, 1).AddDays(i))
    .ToArray();

Plt.Create()
    .WithTitle("Stock Price — Jan to Mar 2025")
    .AddSubPlot(1, 1, 1, ax => ax
        .SetXLabel("Date")
        .SetYLabel("Price ($)")
        .Plot(dates, prices, line => { line.Color = Colors.Tab10Blue; })
        .WithLegend(LegendPosition.UpperRight))
    .Save("date_axis.svg");
Rotated tick labels (v1.7.2 Phase L.8)
When X-axis tick labels are dense enough to overlap (e.g. 31 daily date labels in a narrow plot), the renderer auto-rotates them to 30° — matches matplotlib's Figure.autofmt_xdate() behaviour. Manual control is available for any angle:
Plt.Create()
    .AddSubPlot(1, 1, 1, ax => ax
        .Plot(dates, prices)
        .WithXTickLabelRotation(45)       // force 45°; auto-rotate is bypassed
        .SetXDateFormat("yyyy-MM-dd"))
    .Save("rotated_ticks.svg");
Both axes support rotation via WithXTickLabelRotation(double) / WithYTickLabelRotation(double). Pass 0 to restore horizontal (but dense X-axis labels will still auto-rotate to 30° unless you set a different angle).
Under the hood the TickConfig.LabelRotation property drives the SvgRenderContext.DrawText rotation overload, which emits transform="rotate(...)" on the <text> element. Auto-rotation is detected by comparing adjacent tick pixel spacing against the widest label measurement from Ctx.MeasureText.