Treemaps & Hierarchical Charts
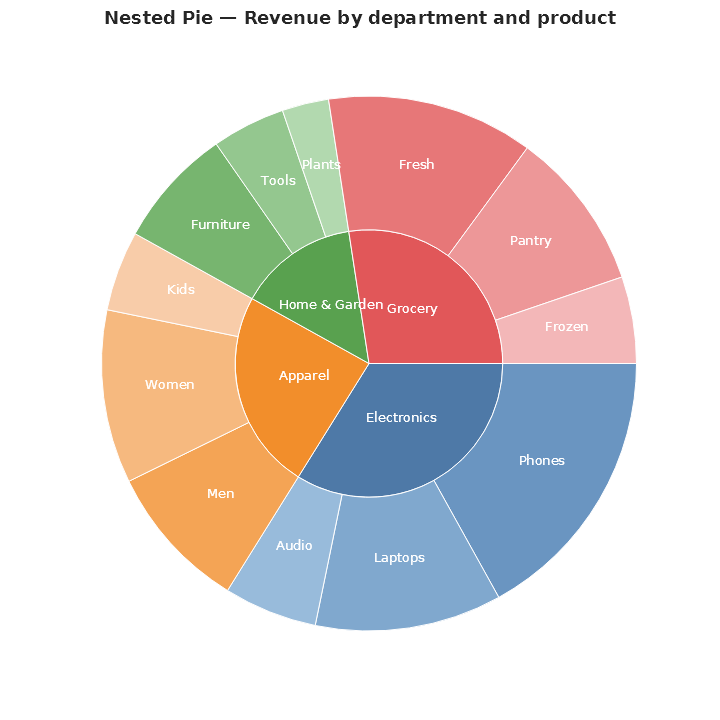
Nested pie
Inner disc of departments + outer ring of product breakdown (thin alias for Sunburst):
Plt.Create()
    .WithTitle("Nested Pie — Revenue by department and product")
    .WithSize(720, 720)
    .AddSubPlot(1, 1, 1, ax => ax.NestedPie(departments))
    .Save("nested_pie.svg");
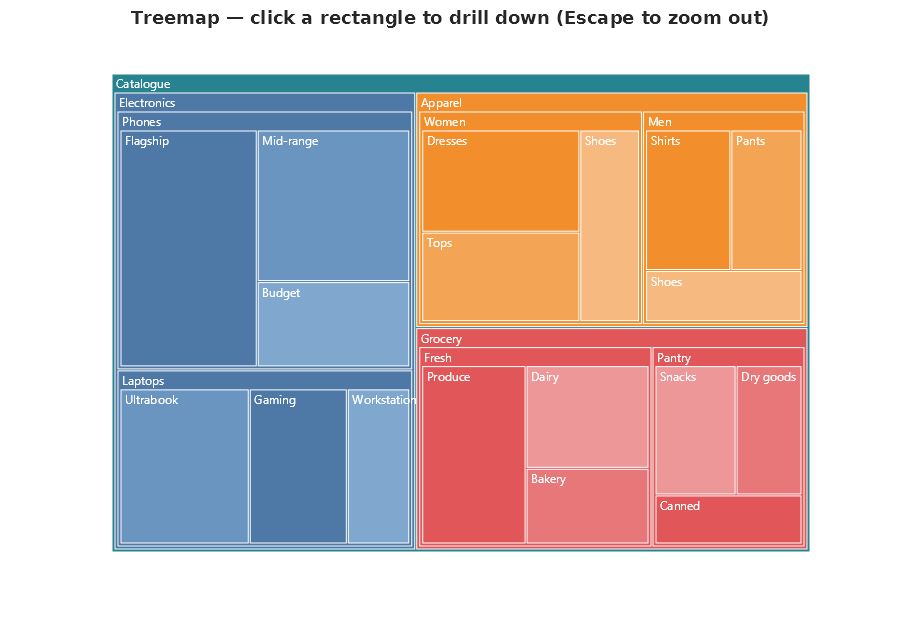
Treemap with expand/collapse
Each interior node renders as a coloured rectangle with a label header along the top; children are squarified into the reduced bounds below that header, so the parent colour visually frames its descendants (matches the d3 flare.json nested-treemap style). The initial interactive view is identical to the static SVG — every node at every depth is visible on first paint ("steady pictures": no visual jump when entering interactive mode). Clicking a parent rect collapses its descendants to focus on the surrounding context; clicking again re-expands. Multiple parents can be collapsed independently. Leaves are not clickable, so the cursor stays default when hovering them.
Labels render at a single readable 12 pt size at every depth (v1.7.2 Phase W). Children paint OVER parents (Shneiderman z-order), so the deepest visible label is what the user sees in any overlapping region — the user reads the most-specific label without anything moving. For static SVG output with deep trees, call .WithAutoSize(root) on the FigureBuilder to pick a canvas big enough to fit every label cleanly without overflow; for interactive output, the user pans/zooms to read overflowing labels.
var catalogue = new TreeNode
{
    Label = "Revenue",
    Children =
    [
        new()
        {
            Label = "Electronics", Value = 42, Color = Colors.Blue,
            Children =
            [
                new()
                {
                    Label = "Phones", Value = 22, Color = Colors.CornflowerBlue,
                    Children =
                    [
                        new() { Label = "iPhone", Value = 12, Color = Colors.RoyalBlue },
                        new() { Label = "Galaxy", Value = 7,  Color = Colors.SteelBlue },
                        new() { Label = "Pixel",  Value = 3,  Color = Colors.CornflowerBlue },
                    ]
                },
                new() { Label = "Laptops", Value = 14, Color = Colors.SteelBlue },
                new() { Label = "TVs",     Value = 6,  Color = Colors.RoyalBlue },
            ]
        },
        new() { Label = "Apparel", Value = 28, Color = Colors.Orange,
            Children = [
                new() { Label = "Men's",   Value = 11, Color = Colors.Chocolate },
                new() { Label = "Women's", Value = 13, Color = Colors.Tomato },
                new() { Label = "Kids'",   Value = 4,  Color = Colors.Coral },
            ]
        },
        new() { Label = "Grocery", Value = 30, Color = Colors.Green,
            Children = [
                new() { Label = "Fresh",  Value = 13, Color = Colors.ForestGreen },
                new() { Label = "Frozen", Value = 9,  Color = Colors.Teal },
                new() { Label = "Pantry", Value = 8,  Color = Colors.Tab10Green },
            ]
        },
    ]
};

Plt.Create()
    .WithTitle("Treemap — every depth visible; click a parent to collapse its subtree, click again to restore")
    .WithAutoSize(catalogue)              // v1.7.2 Phase W — sizes the canvas to fit every label
    .WithTreemapDrilldown()
    .AddSubPlot(1, 1, 1, ax => ax.Treemap(catalogue, s => s.ShowLabels = true))
    .Save("treemap_drilldown.svg");
WithBrowserInteraction() also enables the same expand/collapse behaviour if you prefer the general-purpose fluent method.
v1.7.2 Phase R — click delivery in real browsers fixed. The expand/collapse model itself (Phase P) is unchanged. Two compounding bugs in the click handler were fixed: hover used to latch the drag-suppression flag (so any cursor motion killed the next click), and the pan/zoom script's
setPointerCaptureredirected the synthetic click target to the SVG root (so the rect-walk-up returned null). Now: the move-threshold is gated on anisPointerDownflag, and the click handler falls back todocument.elementFromPointwhen the walk-up misses.