Styling & Themes
26 built-in themes
| Light themes | Dark themes | Accessibility |
|---|---|---|
Theme.Default |
Theme.Dark |
Theme.ColorBlindSafe |
Theme.Seaborn |
Theme.Cyberpunk |
Theme.HighContrast |
Theme.Ggplot |
Theme.Nord |
|
Theme.FiveThirtyEight |
Theme.Dracula |
|
Theme.Bmh |
Theme.Monokai |
|
Theme.Solarize |
Theme.Catppuccin |
|
Theme.Grayscale |
Theme.Gruvbox |
|
Theme.Paper |
Theme.OneDark |
|
Theme.Presentation |
Theme.Neon |
|
Theme.Poster |
||
Theme.GitHub |
||
Theme.Minimal |
||
Theme.Retro |
||
Theme.MatplotlibClassic |
||
Theme.MatplotlibV2 |
See the Themes cookbook page for visual examples and custom theme building.
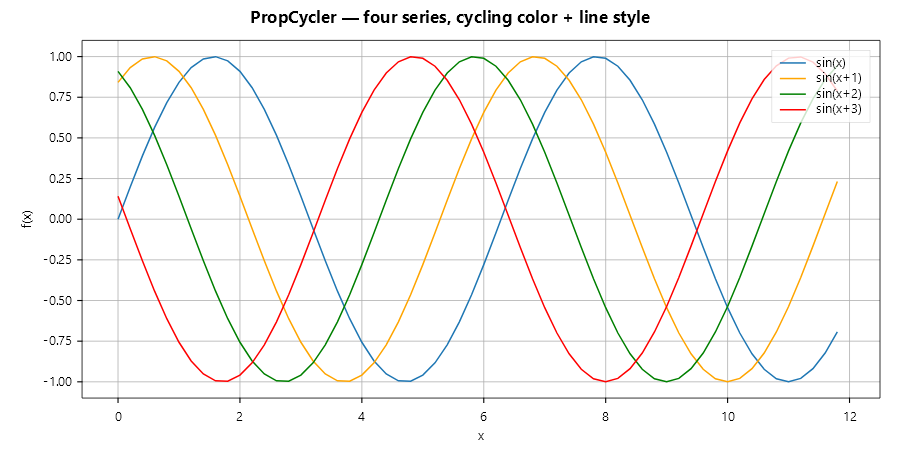
PropCycler
Automatically cycle colors and line styles across multi-series plots:
var cycler = new PropCyclerBuilder()
    .WithColors(Colors.Tab10Blue, Colors.Orange, Colors.Green, Colors.Red)
    .WithLineStyles(LineStyle.Solid, LineStyle.Dashed, LineStyle.Dotted, LineStyle.DashDot)
    .Build();

var theme = Theme.CreateFrom(Theme.Default).WithPropCycler(cycler).Build();

Plt.Create()
    .WithTheme(theme)
    .AddSubPlot(1, 1, 1, ax =>
    {
        ax.Plot(x, y1, s => s.Label = "Series 1");
        ax.Plot(x, y2, s => s.Label = "Series 2");
        // colors and line styles are assigned automatically
        ax.WithLegend(LegendPosition.UpperRight);
    })
    .Save("styled.svg");
Grid and spine styling
Plt.Create()
    .AddSubPlot(1, 1, 1, ax => ax
        .Plot(x, y)
        // Grid with custom styling
        .WithGrid(g => g with
        {
            Color = Colors.LightGray,
            LineStyle = LineStyle.Dotted,
            LineWidth = 0.5,
            Alpha = 0.7
        })
        // Spine visibility
        .WithSpines(s => s with
        {
            Top = false,     // hide top spine
            Right = false,   // hide right spine
            Left = true,
            Bottom = true
        })
        // Or use the shorthand:
        // .HideTopSpine()
        // .HideRightSpine()
    )
    .Save("grid_spines.svg");
Tight margins
Remove all padding around the data:
Plt.Create()
    .AddSubPlot(1, 1, 1, ax => ax
        .Plot(x, y)
        .WithTightMargins()     // data touches spines
        .WithYTicksMirrored()   // Y ticks on both sides
        .WithXTicksMirrored()   // X ticks on top and bottom
    )
    .Save("tight_margins.svg");
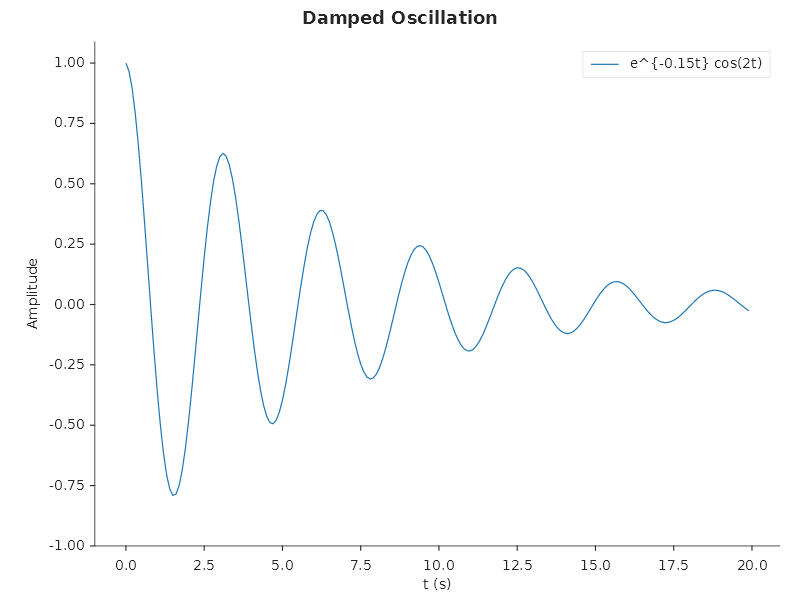
Scientific paper template
Publication-quality defaults: 150 DPI, hidden top/right spines, tight layout:
FigureTemplates.ScientificPaper(
    ax => ax
        .Plot(t, y, s => { s.Label = "e^{-0.15t} cos(2t)"; s.LineWidth = 1.2; })
        .SetXLabel("t (s)")
        .SetYLabel("Amplitude")
        .WithLegend(LegendPosition.UpperRight),
    title: "Damped Oscillation")
.Save("scientific.svg");
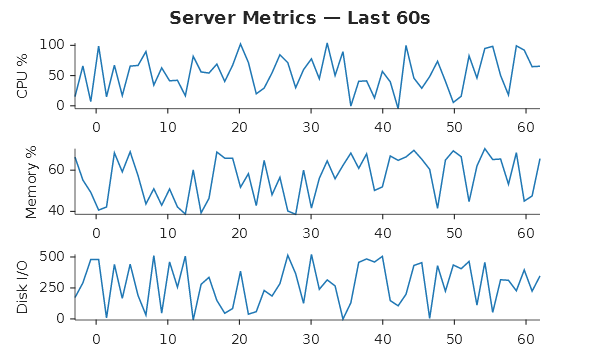
Sparkline dashboard
Compact metric panels — one row per metric, no axes chrome:
FigureTemplates.SparklineDashboard(
    [
        ("CPU %",    cpuData),
        ("Memory %", memData),
        ("Disk I/O", diskData),
    ],
    title: "Server Metrics — Last 60s")
.Save("sparklines.svg");
Hide all axes chrome
For custom visualizations where you control everything:
Plt.Create()
    .AddSubPlot(1, 1, 1, ax => ax
        .HideAllAxes()  // no spines, ticks, or labels
        .Treemap(root, s => s.ShowLabels = true))
    .Save("bare_canvas.svg");
Fluent API reference
| Method | Description |
|---|---|
.WithTheme(Theme) |
Apply a theme preset or custom theme |
.WithBackground(Color) |
Override figure background |
.WithGrid(Func<GridStyle, GridStyle>) |
Grid color, style, width, alpha |
.ShowGrid(bool) |
Show/hide grid |
.WithSpines(Func<SpinesConfig, SpinesConfig>) |
Spine visibility |
.HideTopSpine() |
Hide top spine |
.HideRightSpine() |
Hide right spine |
.HideAllAxes() |
Hide all chrome |
.WithTightMargins() |
Zero axis padding |
.WithYTicksMirrored() |
Y ticks on both sides |
.WithXTicksMirrored() |
X ticks on top and bottom |
.WithMinorTicks(bool) |
Show/hide minor ticks |